- Opinion
- Open access
- Published:
Lights and shadows of cardiac magnetic resonance imaging in acute myocarditis
Insights into Imaging volume 7, pages 99–110 (2016)
Abstract
Cardiac magnetic resonance (CMR) is considered a primary tool for the diagnosis of acute myocarditis, due to its unique potential for non-invasive identification of the various hallmarks of the inflammatory response, with relevant impact on patient management and prognosis. Nonetheless, a marked variation in sensitivity and negative predictive value has been reported in the literature, reflecting the intrinsic drawbacks of current diagnostic criteria, which are based mainly on the use of conventional CMR pulse sequences. As a consequence, a negative exam cannot reliably exclude the diagnosis, especially in patients who do not present an infarct-like onset of disease. The introduction of new-generation mapping techniques further widened CMR potentials, allowing quantification of tissue changes and opening new avenues for non-invasive workup of patients with inflammatory myocardial disease.
Main messages
• CMR sensitivity varies in AM, reflecting its clinical polymorphism and the intrinsic drawbacks of LLc.
• Semiquantitative approaches such as EGEr or T2 ratio have limited accuracy in diffuse disease forms.
• T1 mapping allows objective quantification of inflammation, with no need to normalize measurements.
• A revised protocol including T2-STIR, T1 mapping and LGE could be hypothesized to improve sensitivity.
Introduction
Acute myocarditis (AM) is a “multifaceted disease” characterized by a large variety of acute manifestations, potentially followed by unpredictable sequelae ranging from dilated cardiomyopathy to recurrent arrhythmias [1, 2]. Although relatively common in clinical practice [2, 3], AM is underdiagnosed in the community due to the low sensitivity of conventional diagnostic tools such as ECG, cardiac biomarkers, and viral serology [1]. The use of endomyocardial biopsy (EMB) [4] is controversial, given the lack of standardized protocols and the high prevalence of sampling errors related to the common patchy distribution of myocardial inflammation [4, 5].
In this complex scenario, cardiac magnetic resonance (CMR) was immediately perceived as a potentially “revolutionary” non-invasive tool [6–9], with a unique capacity to characterize the typical hallmarks of myocardial inflammation (Fig. 1). Ghelani et al., for example, reported a retrospective study among a population of 514 patients demonstrating a fivefold increase (from 5.2 to 28.1 %) in the utilization of CMR in AM over a 10-year period from 2006 to 2015, with a significant parallel decline in the rate of EMB [10].

Freehand drawing schematically representing tissue targets of CMR in acute myocarditis. A typical inferior-lateral left ventricular involvement with subepicardial spread is depicted. In most cases, the process derives from a viral infection that induces myocardial necrosis (or apoptosis) and triggers an immunoreactive response, with subsequent vasoactive phenomena and tissue oedema (freehand drawing by Bettina Conti, MD, Sapienza University of Rome)
Current diagnostic criteria (Lake Louise criteria; LLc) are based on the application of a recommended standardized protocol that aims to identify typical signs of the inflammatory cascade, which consist of oedema, regional hyperemia, and cellular death [11]. These criteria have been extensively validated in the literature, and despite suboptimal diagnostic accuracy of about 78 %, are commonly applied in clinical routine [12, 13]. Promising novel T1/T2 mapping techniques have recently been introduced that provide quantitative measurements of tissue changes, minimizing subjectivity and errors common in conventional threshold-based post-processing methods [12–14].
This document analyses lights and shadows of CMR imaging in the diagnostic and prognostic assessment of AM and evaluates the improvement provided by the introduction of T1/T2 mapping techniques into clinical routine.
Diagnostic criteria in the pre-mapping era: lights and shadows
The spectrum of currently available sequences for CMR study of myocarditis is summarized in Table 1.
According to the LLc [11], CMR diagnosis of AM can be established in the presence of at least two of the following three features:
-
a)
myocardial oedema detected by T2-weighted techniques;
-
b)
myocardial hyperemia detected by early gadolinium enhancement (EGE) techniques;
-
c)
myocardial damage with non-ischemic pattern detected by late gadolinium enhancement (LGE) techniques.
These three criteria are considered in addition to steady-state free precession (SSFP) sequences for the assessment of biventricular volumes and global/regional function (Fig. 2).

Comprehensive CMR evaluation in a 27-year-old man with acute myocarditis following an upper respiratory infection. At admission, patient presented with acute chest pain, abnormal ST segment elevation in the inferolateral leads, and mildly elevated troponin; left ventricular global function was preserved (a, b; ejection fraction 56 %). Typical hallmarks of active myocardial inflammation are portrayed, consisting of meso/subepicardial striae of high signal intensity on both T2-STIR and LGE images (c–e), combined with a positive EGEr (d; 7.6). Corresponding native T1 parametric map calculated using a modified Look-Locker inversion recovery (MOLLI) sequence with a 1.5 T magnet (MAGNETOM Avanto; Siemens Healthcare, Erlangen, Germany) shows increased T1 values in the same location (1211 ± 16 ms; normal reference value mean 1027 ± 61 ms; f)
-
1.
OEDEMA and INFLAMMATORY INFILTRATION:
Interstitial or intracellular accumulation of water, together with serological biochemical markers, represents the most reliable sign of active inflammation [15, 16].
Currently, the most widely used and validated technique for “oedema-weighted” imaging is based on the application of T2-weighted short-tau inversion recovery sequences (T2w-STIR) [15, 17, 18]. The STIR technique includes a third 180° inversion pulse integrated into the classical double-inversion recovery black blood turbo spin echo (TSE) pulse sequence. The first and second inversion pulses create a black blood effect; the third inversion pulse leads to the suppression of the signal from fatty tissue and from other stationary tissue with a T1 relaxation time of approximately 200–250 ms. Another important effect of the third pulse enabling the detection of oedema is the effect of the inversion of the long T1 on final signal intensity, so the T1 lengthening related to oedema contributes to the increased signal of oedematous tissue, together with T2 lengthening [19].
Myocardial oedema in AM often proceeds from a focal meso- and subepicardial distribution, which is observed in only about 30 % of patients, to a global pattern of ventricular involvement.
-
Current diagnostic criterion:
-
Definition:
-
T2w-STIR sequences must be performed using the same prescription of SSFP images in short-axis views and in three long-axis planes (two-, three-, and four-chamber views). However, a body coil is recommended to avoid signal heterogeneity as compared to SSFP.
-
The presence of tissue oedema may be detected visually or, as suggested in the LLc, using a semiquantitative method. Regional oedema is defined as region of at least 10 adjacent pixels with signal intensity more than 2 standard deviations above the mean value of normal tissue, evident in two orthogonal planes [11].
-
Diffuse oedema is quantified as the ratio of myocardial to skeletal muscle (T2 ratio) by drawing two distinct regions of interest in the same slice; a ratio ≥ 1.9 is considered positive and reflective of global myocardial oedema [16]. An example of posterolateral left ventricle oedema is showed in Fig. 1.
-
Limitations:
-
T2w-STIR images usually allow reliable visual identification of oedema in patients with a focal pattern of myocardial involvement, although the limited contrast-to-noise ratio (CNR) may impede the detection of subtle tissue changes in a significant minority of patients.
-
Other weaknesses may prevent the interpretation of T2w-STIR images under certain conditions. First, signal heterogeneity related to coil sensitivity profiles can produce both false-negative and false-positive results, and thus the use of reliable surface coil intensity correction filters or body coils is of pivotal importance. Second, the dark blood preparation pulse may introduce regional signal loss in the LV wall, especially in the posterior and posterolateral wall, caused by through-plane cardiac motion. Third, incomplete dark blood preparation may lead to bright rim blood artefacts along the endocardium, especially in patients with impaired ventricular function [20].
-
Another limitation is the qualitative nature of T2w-STIR images, which implies the need for reference tissue for interpretation. In the case of suspected diffuse oedema, the reference tissue is the skeletal muscle, although a concomitant signal change within skeletal muscles, such as that in patients with coexisting myositis, may adversely affect diagnostic performance [21, 22].
-
Finally, a cut-off value of 1.9 was defined using clinical criteria (symptoms, ECG and serologic evidence of myocardial injury, and angiographic exclusion of coronary artery disease) as a reference standard for establishing a diagnosis, without histological validation [16].
-
-
-
2.
HYPEREMIA:
The identification of myocardial hyperemia is the second step of the diagnostic workup, according to the LLc. Endothelial dysfunction and increased vasopermeability have been considered the pathophysiological mechanisms for abnormal diffusion of gadolinium from the vascular compartment to the interstitial space. The tissue hyperemia is evaluated with a technique commonly defined as EGE [11, 16].
-
Current diagnostic criterion:
-
Definition:
-
The technique used to assess myocardial hyperemia in the context of LLc was originally proposed by Abdel-Aty et al. in 2005. A free-breathing black blood fast spin echo (FSE) T1w sequence with an acquisition time of 3–4 min is acquired in four identical axial slices, both before and after (without any change in the parameters in between) intravascular injection of 0.1 mmol of gadopentetate dimeglumine (Gd-DTPA) [11].
-
Sequence parameters should be adjusted to maximize T1 weighting; in particular, an echo train length of less than 4 is desirable. According to LLc, diffuse hyperemia can be detected by calculating the early gadolinium enhancement ratio (EGEr): endocardial and epicardial contours should be traced on both pre- and post-contrast images, and a reference region of interest (ROI) should be placed on the skeletal muscle located within the same slice. The myocardial enhancement should be normalized on the skeletal muscle enhancement, and an EGEr ≥ 4 is considered positive for myocardial inflammation [11].
-
Limitations:
-
EGE imaging is generally considered the least robust of the three components of the LLc, as FSE sequences originally proposed [11] are limited by inconsistent image quality in many patients [21]. In particular, this sequence is highly prone to severe respiratory artefacts caused by free breathing during acquisition.
-
Second, the acquisition of only 3–4 subsequent slices limits anatomic coverage of the left ventricle, impeding a panoramic assessment of the myocardial wall.
-
Third, the cut-off value is validated with one standard-relaxivity contrast medium (Gd-DTPA) and may be not acceptable if higher relaxivity agents are used (e.g., Gd-BOPTA and gadobutrol). Therefore, a redefinition of thresholds is needed for agents with higher relaxivity, as has already been reported in a similar model of breast MRI [23].
-
Fourth, signal normalization may be hampered by coexisting skeletal muscles disease. Hence, in patients with an increase in skeletal muscle signal intensity ≥ 20 %, as well as in patients with a recent history of muscular pain, an increase of > 45 % in absolute myocardial signal intensity between pre- and post-gadolinium images is suggested as a threshold consistent with myocarditis, rather than normalized EGEr [11].
-
An interesting alternative method for fast assessment of myocardial hyperemia in AM was recently reported, which relies on SSFP sequences acquired soon after contrast administration (ceSSFP) [24]. This approach overcomes most of the drawbacks of original FSE sequences and seems to be effective for the identification of areas of regional hyperemia, although it is not yet validated in patients with EMB-proven AM. However, the ceSSFP technique has not yet been implemented in the assessment of diffuse changes involving the entire LV wall, and this is its main limitation.
-
-
-
3.
MYOCYTE DEATH and FIBROSIS
Myocyte necrosis with extracellular space expansion followed by replacement fibrosis occurs in AM as a consequence of either direct viral cellular damage or cell-mediated immunological injury. Both tissue changes lead to an increase in delayed gadolinium accumulation, with subsequent positive LGE. Typical disease patterns are characterized by mid-wall or subepicardial LGE distribution, with patchy or linear areas of high signal intensity [25]. The inferolateral mid-basal wall and the septum are the more involved segments [26]. This pattern is clearly different from the ischemic pattern, the latter characterized by subendocardial or transmural LGE, fitting the segmental distribution of coronary arteries, with possible associated microvascular obstruction.
Several sequences are available today for the assessment of LGE, including the two-dimensional (2D) and three-dimensional (3D) inversion recovery gradient echo sequences (IR-GRE), the 2D and 3D inversion recovery SSFP sequences (IR-SSFP), and the phase-sensitive inversion recovery sequences (PSIR-GRE or PSIR-SSFP) that eliminate the need for a precise null time for normal myocardium. This sequence uses phase-sensitive detection to remove the background phase while preserving the signal of the desired magnetization during IR [27].
Figure 2 (Panel E) shows a typical subepicardial LGE of the lateral wall.
-
Current diagnostic criterion:
-
Definition:
-
LGE is considered positive if at least one focal area of high signal intensity with non-ischemic pattern of distribution is outlined in at least two orthogonal planes [11].
-
Suggested LLc protocol recommends the application of conventional segmented two-dimensional breath-hold IR-GRE pulse sequence.
-
Application of a fat-saturation pre-pulse may also be helpful for discriminating epicardial fat from pathological subepicardial LGE foci.
-
Any quantitative approach for LGE quantification was recommended in the LLc, although semi-automated standard deviation (SD)-based thresholding techniques are commonly used today in different clinical settings, primarily in the assessment of acute myocardial infarction (AMI) [28].
-
Limitations:
-
LGE has been extensively validated as a robust and reproducible technique for detecting myocardial fibrosis and myocyte necrosis in patients with AM [26, 29, 30].
-
However, LGE detection relies on differences in gadolinium concentration between pathological and “normal” segments. Such differences may not exist if the process is diffuse, or may be insufficient to create contrast in the presence of mild focal involvement.
-
Recent data have demonstrated a limited sensitivity of the LGE technique, mainly in patients with less common disease onset such as arrhythmic or cardiomyopathic presentations [31]. These results, correlated with histology, better demonstrate that LGE may be less sensitive for the detection of myocarditis with limited or non-focal myocyte injury.
-
-
Diagnostic performance of LLc
Clinical studies investigating the diagnostic performance of LLc [12] in AM were selected and are reported in Table 2 [12, 16, 21, 30–36].
Pooled analysis of results (Table 2) confirmed that LLc (positivity of 2/3 parameters) are more sensitive than each single parameter, and are thus able to partially overcome their diagnostic limitations. Nevertheless, CMR based on LLc yielded suboptimal results: pooled sensitivity of 77 % and specificity of 81 %, slightly lower than the specificity provided by LGE alone (87 %), with diagnostic accuracy of 78 %.
Prognostic value of CMR
The acute presentation of myocarditis is highly variable, ranging from asymptomatic or mildly symptomatic forms to sudden cardiac death (SCD). AM has been reported to be responsible for at least 5 % of outpatient SCD [37], and this can increase to 42 % in the clinical setting among young patients with AM [38].
The long-term prognosis is usually favorable, but a significant percentage of patients affected by AM experience progressive left ventricle dysfunction and dilatation. Prospective studies have suggested that AM causes at least 10 % of dilated cardiomyopathy [39], and that post-myocarditis scar may represent the substrate of life-threatening ventricular arrhythmias. Therefore, the identification of high-risk patients could have very important clinical implications.
Mahrholdt and colleagues found that left ventricular end-diastolic volume (EDV), the presence of LGE in the interventricular septum, and the total amount of LGE at initial CMR were the strongest independent predictors of impaired ventricular function and ventricular dilatation at follow-up in a cohort of patients with parvovirus B 19 (PVB19) and/or human herpesvirus 6 (HHV6) infections [40]. Moreover, Grün et al. found that LGE was the best independent predictor of both all-cause and cardiac mortality (hazard ratios of 8.4 and 12.8, respectively) in long-term follow-up of 222 consecutive patients with biopsy-proven viral myocarditis [41]. Another interesting result coming from the same cohort of patients was that, independently of left ventricular volumes and function, no patient without LGE experienced SCD [41]. Additionally, Schumm et al. recently reported that a negative CMR in patients referred for clinically suspected myocarditis was associated with good prognosis at follow-up [42].
Diagnostic role of CMR, based on patient presentation
The wide and expanding use of CMR in the clinical setting of AM is attributable to its unique capacity to comprehensively evaluate the various components of myocardial inflammation cascade.
Significant variations in sensitivity and negative predictive values have been reported in the scientific literature, reflecting both the syndromic nature of the disease and the technical drawbacks of conventional CMR sequences, with evidence that a negative CMR exam cannot reliably rule out a diagnosis of AM.
Diagnostic pathways based on the three main clinical scenarios of AM can be suggested as evidence of the recent literature on the diagnostic accuracy and prognostic value of CMR.
-
1)
Patients presenting with acute chest pain, positive troponin test results, and typical ST segment abnormalities
In the setting of symptomatic patients, for chest pain with typical ST elevation, increased troponin, and preserved LV function, CMR is pivotal in the diagnosis of AM.
The first role of CMR is the exclusion of alternative diagnoses with similar clinical presentations, such as takotsubo or AMI with non-obstructive coronary artery disease [43–47].
If the CMR is positive for AM according to LLc, appropriate management needs to be carefully evaluated, taking into account the clinical course and the CMR results, particularly the extent, location, and distribution of LGE [40]. Excellent prognosis is expected in the case of completely normal CMR [42].
EMB is generally not indicated in this specific clinical scenario, according to the scientific statement regarding the role of EMB in the management of cardiovascular disease published by the American Heart Association (AHA), the American College of Cardiology (ACC), and the European Society of Cardiology (ESC) [48]. However, the position statement of the ESC on myocarditis is not in complete agreement on this point [49].
-
2)
Patients with new onset of heart failure syndrome of unknown etiology [16, 43]
CMR is of value for clarifying the underlying pathophysiology in patients presenting with new-onset heart failure (HF) in the absence of chest pain or known prior myocardial infarction, potentially acting as gatekeeper to invasive coronary angiography (Fig. 3) [50].
Fig. 3 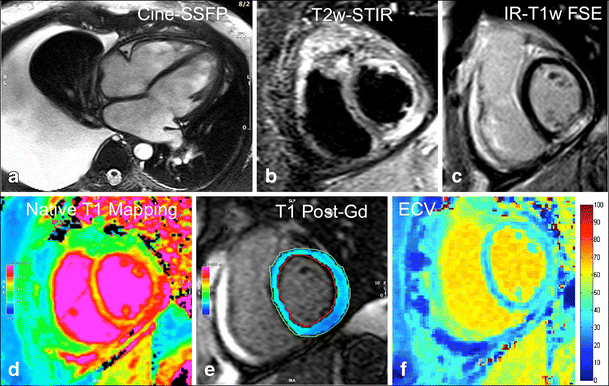
Non-fulminant acute myocarditis in a 44-year-old man presenting with sudden occurrence of signs and symptoms of heart failure (New York Heart Association [NYHA] class III). Cine-SSFP four-chamber end-diastolic frame shows a mildly dilated left ventricular cavity (EDV 187 mL) with significant right-sided pleural effusion; ejection fraction is mildly depressed (44 %). Typical subepicardial striae of high signal intensity are located at the level of the mid-inferior left ventricle on both T2w-STIR (b) and LGE images (c). Native (d) and post-contrast (e) T1 mapping scans were also performed using a modified Look-Locker inversion recovery (MOLLI) sequence with a 1.5 T scanner (MAGNETOM Avanto; Siemens Healthcare, Erlangen, Germany), showing abnormally elevated extracellular volume within the mid-inferior segment (36.7 %).
Post-myocarditis forms, however, are not always recognizable in this specific setting due to a prolonged subacute myocardial inflammation preceding clinical manifestations, and leading to progressive water reabsorption with less evident signal changes [31].
EMB remains the primary alternative for these patients [51] due to the meaningful impact on subsequent therapeutic decisions [49].
-
3)
Patients presenting with sudden occurrence of palpitations/lipothymia-hypotension related to the presence of previously unknown ventricular arrhythmias
In this clinical scenario, CMR may help to identify AM as the underlying cause of clinical presentation [52], although mild forms of inflammation may result in a negative CMR examination [31].
CMR plays a role in the identification of other potential causes of previously undiagnosed ventricular arrhythmias, such as arrhythmogenic right ventricular dysplasia, non-compaction disease, atypical forms of hypertrophic cardiomyopathy, and unknown chronic myocardial scars [52]. CMR can also detect unexpected causes of acute myocardial injury such as an unrecognized myocardial infarction. Moreover, CMR results may provide important prognostic information that should be considered in patient management.
Indication of EMB is not well established in these patients: EMB should be considered only in exceptional cases of unexplained ventricular arrhythmias [51], but it is generally recommended when clinical and imaging evaluation provides significant evidence of AM [49].

New insights and future developments: myocardial mapping
The major limitations of current LLc are the qualitative (LGE depiction) or semiquantitative (T2 ratio and EGEr) nature of the diagnostic criteria, which significantly affects the sensitivity of the CMR technique in the characterization of global myocardial processes.
To overcome many of these limitations, current research has developed absolute quantitative approaches such as T1 and T2 mapping techniques.
Native T1 mapping
Measurement of native myocardial longitudinal relaxation time (T1 mapping) has emerged as a novel quantitative approach to enable the depiction of diffuse inflammatory processes. It is based on the generation of parametric maps representing the T1 relaxation times encoded in each pixel of any region of the heart, without the need to normalize measurements to a reference standard tissue [14, 53, 54].
The basic principle of this technique relies on the concept that pixel signal intensity depends on the relaxation of hydrogen nuclei protons in a static magnetic field, which varies in the presence of oedema, fat infiltration, and fibrosis [21].
Specifically, the prolongation of T1 relaxation time in AM is related to an increase in both total and relative water content in the intra- and extracellular space due to tissue oedema and expansion of intercellular space [55]. A second phenomenon, further enhancing T1 prolongation, is the altered electrolyte distribution in the inflamed myocardial tissue, affecting the motion of protons [56]. An initial experience published by Ferreira et al. showed excellent diagnostic performance of native T1 mapping in the clinical setting of AM, with around 90 % overall sensitivity, specificity, and diagnostic accuracy [57].
More recently, Luetkens et al. convincingly demonstrated the importance of a CMR multiparametric approach [21]. Native myocardial T1 mapping proved to be superior to the EGEr technique and, alone, provided sensitivity comparable to that obtained with the established LLc (92 vs. 92 %, respectively) [19, 21]. Hinojar et al. also reported the applicability of a new diagnostic algorithm using native T1 for differentiating acute from convalescent myocarditis (native T1 values: 940 vs. 1064 vs. 995 ms at 1.5 T and 1045 vs. 1189 vs. 1099 ms at 3 T in controls, acute myocarditis, and convalescent myocarditis, respectively) [35].
Notably, a marked variation in diagnostic thresholds among normal subjects has been reported in the literature [58]. This variation in normal values of myocardial T1 is a reflection of its direct dependence on magnetic field strength, different physiologic parameters (mainly age, gender, and heart rate), scanning parameters (mainly flip angle, matrix, and slice thickness), and image analysis methods. One of the major risks is the partial volume effect arising from over-inclusion of neighbouring tissue [59]. Hence, in agreement with current consensus statement [53], the validation of the imaging protocol in each site using a reference sample of “normal subjects” is highly recommended in order to minimize measurement errors. A more robust application of this approach would certainly require greater standardization and larger validation studies, which are currently lacking in the literature.
Pre- and post-contrast T1 mapping with extracellular volume fraction
Extracellular volume fraction (ECV) provides a direct measurement of the size of the extracellular space. ECV map generation is based on a pixel-wise co-registration and comparison of native and post-contrast T1 maps, adjusted for the patient’s hematocrit [53]. In AM, an increase in ECV reflects myocardial oedema and inflammation as well as myocyte necrosis and subsequent myocardial fibrosis [21, 34, 60, 61]. In recent studies, ECV alone achieved diagnostic accuracy of approximately 75 % [21, 34, 36], which can improve to 90 % if ECV ≥ 27 % is combined with the presence of LGE in a stepwise diagnostic approach [34].
T2 mapping
An increased signal in T2-weighted images, which is linked to T2 relaxation time (T2-rt) lengthening, is a well-known MR sign of cardiac and skeletal muscle damage, reflecting heterogeneous phenomena such as oedema and inflammation. Qualitative assessment of T2-weighted imaging is limited by signal intensity heterogeneities and by the absence of the “perfect” reference tissue for signal normalization. Direct measurement of T2-rt accurately reflects inflammation in the skeletal muscles [62] and also allows non-invasive monitoring of inflammatory infiltration in the same setting [63]. Hence, T2 mapping also holds promise as an attractive alternative for the assessment of myocardial inflammation, particularly in the case of diffuse oedema rather than focal involvement.
A T2-prepared steady-state free precession (T2p-SSFP) technique has been described as a means of minimizing the problems associated with current cardiac T2W imaging methods, and of providing an accurate assessment of myocardial oedema [64]. This T2p-SSFP approach allows the generation of three T2w images, each with different T2 preparation times, in a single breath-hold (seven R–R intervals required). Images obtained with this technique are less sensitive than those of classical T2w-STIR to motion artefacts induced by arrhythmias or imperfect breath-hold, and can be processed to fit the T2 decay curve at each pixel to yield a T2 map. These T2 maps also solve the critical problem of signal heterogeneity linked to the use of multi-element surface coils that typically affects STIR images. Results of T2 mapping have shown promise in the detection of myocardial involvement in acute inflammatory cardiomyopathy, in particular in patients with myocarditis and takotsubo cardiomyopathy, where T2 mapping allows the delineation of a greater extent of myocardial involvement than wall motion abnormalities, T2w-STIR, or LGE [65]. However, no other studies have confirmed the value of myocardial T2 mapping in AM, and thus further evidence from multicenter trials is needed to prove its reproducibility and to assess its potential clinical role in patients with suspected AM.
Conclusions
Since the publication of the JACC White Paper entitled “Cardiovascular Magnetic Resonance in Myocarditis” in 2009, the relevance of CMR as a component of the clinical workup in AM has increased dramatically. Several years of application of LLc have allowed for a better understanding of their value and limits, revealing flaws in providing wishful diagnostic results in some clinical situations. The EGE seems to be the weakest point of LLc, both with respect to the presence of ambiguity and, more importantly, with the strong artefacts that very frequently affect this technique. T2w-STIR sequences, although potentially affected by artefacts in some patients and limited in the assessment of mild and diffuse forms of myocardial involvement, may provide an intuitive and rapid means of ascertaining active inflammation in focal forms of disease. LGE is primarily affected by low sensitivity, but has significant value in differential diagnosis and prognostic evaluation. New perspectives in the diagnostic potential of CMR were highlighted by the recent introduction of mapping sequences, which provide insight into quantitative assessment of inflammatory myocardial changes. New scientific evidence supports the value and robustness of T1 mapping techniques in the diagnosis of AM, with the chief advantage of increasing CMR sensitivity. However, larger multicenter trials are needed to develop a standardized T1/T2 mapping technique and to define widely accepted normal thresholds values. On the other hand, a step-by-step simple CMR protocol including T2w-STIR, T1 mapping, and LGE (Fig. 4) could be hypothesized and tested experimentally and in clinical practice.

Revised diagnostic algorithm for the clinical workup in patients with clinically suspected acute myocarditis. Routine inclusion of T1 mapping techniques (native and ECV) in the scanning protocol would enable the coupling of the high specificity of T2-STIR and LGE techniques with the increased sensitivity of T1-relaxation changes measurements (particularly in mild focal or diffuse forms of disease). According to the literature, a combination of functional data and inflammation/necrosis imaging correlates provided by CMR may serve as a predictor of functional and clinical recovery at follow-up (see text for further explanation).
Abbreviations
- AM:
-
Acute myocarditis
- AMI:
-
Acute myocardial infarction
- ARVD/C:
-
Arrhythmogenic right ventricular dysplasia/cardiomyopathy
- ceSSFP:
-
Contrast-enhanced steady-state free precession
- CMP:
-
Cardiomyopathy
- CMR:
-
Cardiovascular magnetic resonance
- ECV:
-
Extracellular volume fraction
- EDV:
-
End-diastolic volume
- EGEr:
-
Early gadolinium enhancement ratio
- EMB:
-
Endomyocardial biopsy
- Gd-BOPTA:
-
Gadolinium benzyloxy-propionic-tetraacetic acid
- Gd-DTPA:
-
Gadopentetate dimeglumine
- FSE:
-
Fast spin echo
- HHV6:
-
Human herpesvirus 6
- IR-GRE:
-
Inversion recovery gradient echo
- IR-SSFP:
-
Inversion recovery steady-state free precession
- LGE:
-
Late gadolinium enhancement
- LLc:
-
Lake Louise criteria
- LV:
-
Left ventricle
- NT-pro BNP:
-
N-terminal of the prohormone brain natriuretic peptide
- PVB19:
-
Parvovirus B 19
- PSIR:
-
Phase-sensitive inversion recovery
- ROI:
-
Region of interest
- SCD:
-
Sudden cardiac death
- SSFP:
-
Steady-state free precession
- TSE:
-
Turbo spin echo
- TT-CMP:
-
Takotsubo cardiomyopathy
- T2p-SSFP:
-
T2-prepared steady-state free precession
- T2w-STIR:
-
Short-tau inversion recovery prepared fast spin echo
References
Cooper LT Jr (2009) Myocarditis. N Engl J Med 360:1526–1538
Jeserich M, Konstantinides S, Pavlik G, Bode C, Geibel A (2009) Non-invasive imaging in the diagnosis of acute viral myocarditis. Clin Res Cardiol 98:753–763
Fabre A, Sheppard MN (2006) Sudden adult death syndrome and other non-ischaemic causes of sudden cardiac death. Heart 92:316–320
Hauck AJ, Kearney DL, Edwards WD (1989) Evaluation of postmortem endomyocardial biopsy specimens from 38 patients with lymphocytic myocarditis: implications for role of sampling error. Mayo Clin Proc 64:1235–1245
Kindermann I, Kindermann M, Kandolf R et al (2008) Predictors of outcome in patients with suspected myocarditis. Circulation 118:639–648
Francone M, Di Cesare E, Cademartiri F et al (2014) Italian registry of cardiac magnetic resonance. Eur J Radiol 83:e15–e22
Bruder O, Wagner A, Lombardi M et al (2013) European Cardiovascular Magnetic Resonance (EuroCMR) registry--multi national results from 57 centers in 15 countries. J Cardiovasc Magn Reson 15:9
Mavrogeni S, Bratis K, Papadopoulos G et al (2013) The Greek cardiac magnetic resonance experience: a comparison with the EuroCMR Registry. Hell J Cardiol 54:355–361
Antony R, Daghem M, McCann GP et al (2011) Cardiovascular magnetic resonance activity in the United Kingdom: a survey on behalf of the British Society of Cardiovascular Magnetic Resonance. J Cardiovasc Magn Reson 13:57
Ghelani SJ, Spaeder MC, Pastor W, Spurney CF, Klugman D (2012) Demographics, trends, and outcomes in pediatric acute myocarditis in the United States, 2006 to 2011. Circ Cardiovasc Qual Outcomes 5:622–627
Friedrich MG, Sechtem U, Schulz-Menger J et al (2009) Cardiovascular magnetic resonance in myocarditis: a JACC white paper. J Am Coll Cardiol 53:1475–1487
Chu GC, Flewitt JA, Mikami Y, Vermes E, Friedrich MG (2013) Assessment of acute myocarditis by cardiovascular MR: diagnostic performance of shortened protocols. Int J Cardiovasc Imaging 29:1077–1083
Schulz-Menger J (2014) Diagnostic accuracy of CMR in biopsy-proven acute myocarditis. JACC Cardiovasc Imaging 7:264–266
Perea RJ, Ortiz-Perez JT, Sole M et al (2015) T1 mapping: characterisation of myocardial interstitial space. Insights Imaging 6:189–202
Francone M, Carbone I, Agati L et al (2011) Utility of T2-weighted short-tau inversion recovery (STIR) sequences in cardiac MRI: an overview of clinical applications in ischaemic and non-ischaemic heart disease. Radiol Med 116:32–46
Abdel-Aty H, Boye P, Zagrosek A et al (2005) Diagnostic performance of cardiovascular magnetic resonance in patients with suspected acute myocarditis: comparison of different approaches. J Am Coll Cardiol 45:1815–1822
Abdel-Aty H (2009) Myocardial edema imaging of the area at risk in acute myocardial infarction: seeing through water. JACC Cardiovasc Imaging 2:832–834
Abdel-Aty H, Cocker M, Meek C, Tyberg JV, Friedrich MG (2009) Edema as a very early marker for acute myocardial ischemia: a cardiovascular magnetic resonance study. J Am Coll Cardiol 53:1194–1201
Dwyer AJ, Frank JA, Sank VJ, Reinig JW, Hickey AM, Doppman JL (1988) Short-Ti inversion-recovery pulse sequence: analysis and initial experience in cancer imaging. Radiology 168:827–836
Eitel I, Friedrich MG (2011) T2-weighted cardiovascular magnetic resonance in acute cardiac disease. J Cardiovasc Magn Reson 13:13
Luetkens JA, Doerner J, Thomas DK et al (2014) Acute myocarditis: multiparametric cardiac MR imaging. Radiology 273:383–392
Laissy JP, Messin B, Varenne O et al (2002) MRI of acute myocarditis: a comprehensive approach based on various imaging sequences. Chest 122:1638–1648
Sardanelli F, Fausto A, Esseridou A, Di Leo G, Kirchin MA (2008) Gadobenate dimeglumine as a contrast agent for dynamic breast magnetic resonance imaging: effect of higher initial enhancement thresholds on diagnostic performance. Invest Radiol 43:236–242
Perfetti M, Malatesta G, Alvarez I et al (2014) A fast and effective method to assess myocardial hyperemia in acute myocarditis by magnetic resonance. Int J Cardiovasc Imaging 30:629–637
Bohl S, Wassmuth R, Abdel-Aty H et al (2008) Delayed enhancement cardiac magnetic resonance imaging reveals typical patterns of myocardial injury in patients with various forms of non-ischemic heart disease. Int J Cardiovasc Imaging 24:597–607
Mahrholdt H, Goedecke C, Wagner A et al (2004) Cardiovascular magnetic resonance assessment of human myocarditis: a comparison to histology and molecular pathology. Circulation 109:1250–1258
Viallon M, Jacquier A, Rotaru C et al (2011) Head-to-head comparison of eight late gadolinium-enhanced cardiac MR (LGE CMR) sequences at 1.5 tesla: from bench to bedside. J Magn Reson Imaging 34:1374–1387
Bondarenko O, Beek AM, Hofman MB et al (2005) Standardizing the definition of hyperenhancement in the quantitative assessment of infarct size and myocardial viability using delayed contrast-enhanced CMR. J Cardiovasc Magn Reson 7:481–485
De Cobelli F, Pieroni M, Esposito A et al (2006) Delayed gadolinium-enhanced cardiac magnetic resonance in patients with chronic myocarditis presenting with heart failure or recurrent arrhythmias. J Am Coll Cardiol 47:1649–1654
Lurz P, Eitel I, Adam J et al (2012) Diagnostic performance of CMR imaging compared with EMB in patients with suspected myocarditis. JACC Cardiovasc Imaging 5:513–524
Francone M, Chimenti C, Galea N et al (2014) CMR sensitivity varies with clinical presentation and extent of cell necrosis in biopsy-proven acute myocarditis. JACC Cardiovasc Imaging 7:254–263
Stensaeth KH, Hoffmann P, Fossum E, Mangschau A, Sandvik L, Klow NE (2012) Cardiac magnetic resonance visualizes acute and chronic myocardial injuries in myocarditis. Int J Cardiovasc Imaging 28:327–335
Rottgen R, Christiani R, Freyhardt P et al (2011) Magnetic resonance imaging findings in acute myocarditis and correlation with immunohistological parameters. Eur Radiol 21:1259–1266
Radunski UK, Lund GK, Stehning C et al (2014) CMR in patients with severe myocarditis: diagnostic value of quantitative tissue markers including extracellular volume imaging. JACC Cardiovasc Imaging 7:667–675
Hinojar R, Foote L, Arroyo Ucar E et al (2015) Native T1 in discrimination of acute and convalescent stages in patients with clinical diagnosis of myocarditis: a proposed diagnostic algorithm using CMR. JACC Cardiovasc Imaging 8:37–46
Sramko M, Kubanek M, Tintera J et al (2013) Utility of combination of cardiac magnetic resonance imaging and high-sensitivity cardiac troponin T assay in diagnosis of inflammatory cardiomyopathy. Am J Cardiol 111:258–264
Lecomte D, Fornes P, Fouret P, Nicolas G (1993) Isolated myocardial fibrosis as a cause of sudden cardiac death and its possible relation to myocarditis. J Forensic Sci 38:617–621
Basso C, Calabrese F, Corrado D, Thiene G (2001) Postmortem diagnosis in sudden cardiac death victims: macroscopic, microscopic and molecular findings. Cardiovasc Res 50:290–300
Pauschinger M, Bowles NE, Fuentes-Garcia FJ et al (1999) Detection of adenoviral genome in the myocardium of adult patients with idiopathic left ventricular dysfunction. Circulation 99:1348–1354
Mahrholdt H, Wagner A, Deluigi CC et al (2006) Presentation, patterns of myocardial damage, and clinical course of viral myocarditis. Circulation 114:1581–1590
Grun S, Schumm J, Greulich S et al (2012) Long-term follow-up of biopsy-proven viral myocarditis: predictors of mortality and incomplete recovery. J Am Coll Cardiol 59:1604–1615
Schumm J, Greulich S, Wagner A et al (2014) Cardiovascular magnetic resonance risk stratification in patients with clinically suspected myocarditis. J Cardiovasc Magn Reson 16:14
Eitel I, Behrendt F, Schindler K et al (2008) Differential diagnosis of suspected apical ballooning syndrome using contrast-enhanced magnetic resonance imaging. Eur Heart J 29:2651–2659
Iacucci I, Carbone I, Cannavale G et al (2013) Myocardial oedema as the sole marker of acute injury in Takotsubo cardiomyopathy: a cardiovascular magnetic resonance (CMR) study. Radiol Med 118:1309–1323
Steen H, Madadi-Schroeder M, Lehrke S, Lossnitzer D, Giannitsis E, Katus HA (2010) Staged cardiovascular magnetic resonance for differential diagnosis of troponin T positive patients with low likelihood for acute coronary syndrome. J Cardiovasc Magn Reson 12:51
Monney PA, Sekhri N, Burchell T et al (2011) Acute myocarditis presenting as acute coronary syndrome: role of early cardiac magnetic resonance in its diagnosis. Heart 97:1312–1318
Gerbaud E, Harcaut E, Coste P et al (2012) Cardiac magnetic resonance imaging for the diagnosis of patients presenting with chest pain, raised troponin, and unobstructed coronary arteries. Int J Cardiovasc Imaging 28:783–794
Cooper LT, Baughman KL, Feldman AM et al (2007) The role of endomyocardial biopsy in the management of cardiovascular disease: a scientific statement from the American Heart Association, the American College of Cardiology, and the European Society of Cardiology. Endorsed by the Heart Failure Society of America and the Heart Failure Association of the European Society of Cardiology. J Am Coll Cardiol 50:1914–1931
Caforio AL, Pankuweit S, Arbustini E et al (2013) Current state of knowledge on aetiology, diagnosis, management, and therapy of myocarditis: a position statement of the European Society of Cardiology Working Group on Myocardial and Pericardial Diseases. Eur Heart J 34:2636–2648, 2648a-2648d
Assomull RG, Shakespeare C, Kalra PR et al (2011) Role of cardiovascular magnetic resonance as a gatekeeper to invasive coronary angiography in patients presenting with heart failure of unknown etiology. Circulation 124:1351–1360
Cooper LT, Baughman KL, Feldman AM et al (2007) The role of endomyocardial biopsy in the management of cardiovascular disease: a scientific statement from the American Heart Association, the American College of Cardiology, and the European Society of Cardiology. Circulation 116:2216–2233
White JA, Fine NM, Gula L et al (2012) Utility of cardiovascular magnetic resonance in identifying substrate for malignant ventricular arrhythmias. Circ Cardiovasc Imaging 5:12–20
Moon JC, Messroghli DR, Kellman P et al (2013) Myocardial T1 mapping and extracellular volume quantification: a Society for Cardiovascular Magnetic Resonance (SCMR) and CMR Working Group of the European Society of Cardiology consensus statement. J Cardiovasc Magn Reson 15:92
Mahmod M, Piechnik SK, Levelt E et al (2014) Adenosine stress native T1 mapping in severe aortic stenosis: evidence for a role of the intravascular compartment on myocardial T1 values. J Cardiovasc Magn Reson 16:92
Williams ES, Kaplan JI, Thatcher F, Zimmerman G, Knoebel SB (1980) Prolongation of proton spin lattice relaxation times in regionally ischemic tissue from dog hearts. J Nucl Med 21:449–453
Liu PP, Mason JW (2001) Advances in the understanding of myocarditis. Circulation 104:1076–1082
Ferreira VM, Piechnik SK, Dall’Armellina E et al (2013) T(1) mapping for the diagnosis of acute myocarditis using CMR: comparison to T2-weighted and late gadolinium enhanced imaging. JACC Cardiovasc Imaging 6:1048–1058
Piechnik SK, Ferreira VM, Lewandowski AJ et al (2013) Normal variation of magnetic resonance T1 relaxation times in the human population at 1.5 T using ShMOLLI. J Cardiovasc Magn Reson 15:13
Ferreira VM, Piechnik SK, Dall’Armellina E et al (2014) Native T1-mapping detects the location, extent and patterns of acute myocarditis without the need for gadolinium contrast agents. J Cardiovasc Magn Reson 16:36
Kellman P, Wilson JR, Xue H, Ugander M, Arai AE (2012) Extracellular volume fraction mapping in the myocardium, part 1: evaluation of an automated method. J Cardiovasc Magn Reson 14:63
Flett AS, Hayward MP, Ashworth MT et al (2010) Equilibrium contrast cardiovascular magnetic resonance for the measurement of diffuse myocardial fibrosis: preliminary validation in humans. Circulation 122:138–144
Sciorati C, Esposito A, Campana L et al (2014) 7-Tesla magnetic resonance imaging precisely and noninvasively reflects inflammation and remodeling of the skeletal muscle in a mouse model of antisynthetase syndrome. Biomed Res Int 2014:879703
Esposito A, Campana L, Palmisano A et al (2013) Magnetic resonance imaging at 7T reveals common events in age-related sarcopenia and in the homeostatic response to muscle sterile injury. PLoS One 8, e59308
Giri S, Chung YC, Merchant A et al (2009) T2 quantification for improved detection of myocardial edema. J Cardiovasc Magn Reson 11:56
Thavendiranathan P, Walls M, Giri S et al (2012) Improved detection of myocardial involvement in acute inflammatory cardiomyopathies using T2 mapping. Circ Cardiovasc Imaging 5:102–110
Acknowledgement
Dedicated to Antonio Francone, Professor of Radiology and SIRM honorary member, who inspired this manuscript and my whole life (MF).
Author information
Authors and Affiliations
Consortia
Corresponding author
Additional information
Antonio Esposito and Marco Francone contributed equally to the preparation of the manuscript
Rights and permissions
Open Access This article is distributed under the terms of the Creative Commons Attribution 4.0 International License (http://creativecommons.org/licenses/by/4.0/), which permits unrestricted use, distribution, and reproduction in any medium, provided you give appropriate credit to the original author(s) and the source, provide a link to the Creative Commons license, and indicate if changes were made.
About this article

Cite this article
Esposito, A., Francone, M., Faletti, R. et al. Lights and shadows of cardiac magnetic resonance imaging in acute myocarditis. Insights Imaging 7, 99–110 (2016). https://doi.org/10.1007/s13244-015-0444-7
Received:
Revised:
Accepted:
Published:
Issue Date:
DOI: https://doi.org/10.1007/s13244-015-0444-7