- Educational Review
- Open access
- Published:
Benign and malignant focal liver lesions displaying rim arterial phase hyperenhancement on CT and MRI
Insights into Imaging volume 15, Article number: 178 (2024)
Abstract
Rim arterial phase hyperenhancement is an imaging feature commonly encountered on contrast-enhanced CT and MRI in focal liver lesions. Rim arterial phase hyperenhancement is a subtype of arterial phase hyperenhancement mainly present at the periphery of lesions on the arterial phase. It is caused by a relative arterialization of the periphery compared with the center of the lesion and needs to be differentiated from other patterns of peripheral enhancement, including the peripheral discontinuous nodular enhancement and the corona enhancement. Rim arterial phase hyperenhancement may be a typical or an atypical imaging presentation of many benign and malignant focal liver lesions, challenging the radiologists during imaging interpretation. Benign focal liver lesions that may show rim arterial phase hyperenhancement may have a vascular, infectious, or inflammatory origin. Malignant focal liver lesions displaying rim arterial phase hyperenhancement may have a vascular, hepatocellular, biliary, lymphoid, or secondary origin. The differences in imaging characteristics on contrast-enhanced CT may be subtle, and a multiparametric approach on MRI may be helpful to narrow the list of differentials. This article aims to review the broad spectrum of focal liver lesions that may show rim arterial phase hyperenhancement, using an approach based on the benign and malignant nature of lesions and their histologic origin.
Critical relevance statement
Rim arterial phase hyperenhancement may be an imaging feature encountered in benign and malignant focal liver lesions and the diagnostic algorithm approach provided in this educational review may guide toward the final diagnosis.
Key Points
-
Several focal liver lesions may demonstrate rim arterial phase hyperenhancement.
-
Rim arterial phase hyperenhancement may occur in vascular, inflammatory, and neoplastic lesions.
-
Rim arterial phase hyperenhancement may challenge radiologists during image interpretation.
Graphical Abstract

Introduction
Peripheral arterial enhancement of focal liver lesions is an imaging feature that encompasses different patterns occurring in the arterial phase (AP) on contrast-enhanced CT and/or MRI, including the presence of peripheral nodular discontinuous enhancement, rim arterial phase hyperenhancement (rim APHE), and corona enhancement. Rim APHE is defined as the presence of hyperenhancement of the peripheral portions of a lesion during the AP due to relative arterialization of the periphery compared to the center [1]. Peripheral discontinuous nodular enhancement is a temporal enhancement pattern that progresses centripetally and parallels the blood pool from the AP to the portal venous (PVP) and delayed phases (DP). It is typically encountered in cavernous hemangiomas [1]. Corona enhancement is characterized by a perilesional enhancement with variable thickness and flame-shaped borders in late AP or early PVP. The enhancement is contiguous to the lesion and surrounds all or part of the lesion. Corona enhancement is part of the Liver Imaging Reporting and Data System version 2018 (LI-RADSv2018) ancillary features favoring malignancy in general but not specific for hepatocellular carcinoma (HCC) in high-risk patients [1, 2].
In the general population, rim APHE may be encountered in benign liver lesions with vascular, infectious, or inflammatory origin and malignant lesions, including both primary and secondary malignancies, with the most common being cholangiocarcinoma and metastases (Fig. 1). Benign and malignant focal liver lesions may display rim APHE as a typical imaging feature or an atypical presentation due to internal changes within the lesion. In patients at high risk for HCC (i.e., cirrhosis, chronic hepatitis B infection, or current/prior history of HCC), the presence of rim APHE is recognized as one of the main imaging features classifying an observation as LR-M category, i.e., definitely or probably malignant, but not specific for HCC [1, 2]. However, outside of the high-risk HCC population, benign entities may also exhibit rim APHE [3], and a multiparametric approach to MRI sequences—as well as the assessment of patient history and laboratory tests—may allow narrowing the list of differentials.

Proposed diagnostic algorithm flowchart for distinguishing between different focal liver lesions with rim peripheral enhancement. APHE, arterial phase hyperenhancement; CDL, chronic liver disease; EHE, epithelioid hemangioendothelioma; iCCA, intrahepatic cholangiocarcinoma; PHL, primary hepatic lymphoma; HCC, hepatocellular carcinoma; cHCC-CCA, combined hepatocellular-cholangiocarcinoma tumor; FLC, fibrolamellar hepatocellular carcinoma; EBV, Epstein–Barr virus; c.e., contrast enhancement
This review article aims to review the broad spectrum of focal liver lesions that may show rim APHE, using an approach based on the benign and malignant nature of lesions and their histologic origin.
Benign
Vascular
Sclerosed hemangioma
Sclerosed hemangiomas are rare, and they can be considered an end stage of hemangioma involution, characterized by various degenerative changes such as extensive fibrosis with subsequent hyalinization, marked narrowing or obliteration of the vascular spaces, and hemorrhage or sclerosis [4, 5]. Sclerosed hemangiomas are more commonly encountered in cirrhotic liver and may show over time capsular retraction, decrease in size, loss of previously seen regions of enhancement, or fibrotic changes [5, 6]. On contrast-enhanced CT, variable enhancement patterns have been reported. Sclerosed hemangiomas may show a rim APHE that persists on PVP (Fig. 2), with irregular regions of delayed enhancement within the lesions that manifested as areas of mild hyperattenuation compared with adjacent liver [7,8,9]. In addition, an arterioportal shunt in the AP that fades in the PVP may occur at the periphery of the lesion [8, 9]. On MRI, sclerosed hemangioma shows variable signal intensity (SI) on T2-weighted imaging (WI), particularly in larger lesions in which internal fibrotic septa show low or heterogeneous SI on T1-WI and high SI on T2-WI, oval-shaped contours, and liver capsular retraction [8, 9]; compared with cavernous hemangioma, the stroma of the sclerosed hemangioma contained abundance of collagenous tissue and elastic fibers around and between small sclerotic vessels [8, 9]. Tips for the radiological characterization include the presence of T2-shine-through on the apparent diffusion coefficient (ADC) map and the high SI on T2-WI, although usually slightly lower than typical hemangiomas (Fig. 2). In addition, challenging cases may benefit from ultra-DP acquisitions at 10 min after intravenous administration of extracellular contrast agents to observe the centripetal enhancement and contrast retention within the lesion [8,9,10]. On gadoxetate disodium-enhanced magnetic resonance imaging (Gd-EOB-MRI), sclerosed hemangioma appears hypointense compared to the background liver parenchyma during the transitional and hepatobiliary phases, with marginal hyperintensity in the peripheral area due to fibrous changes [7,8,9].
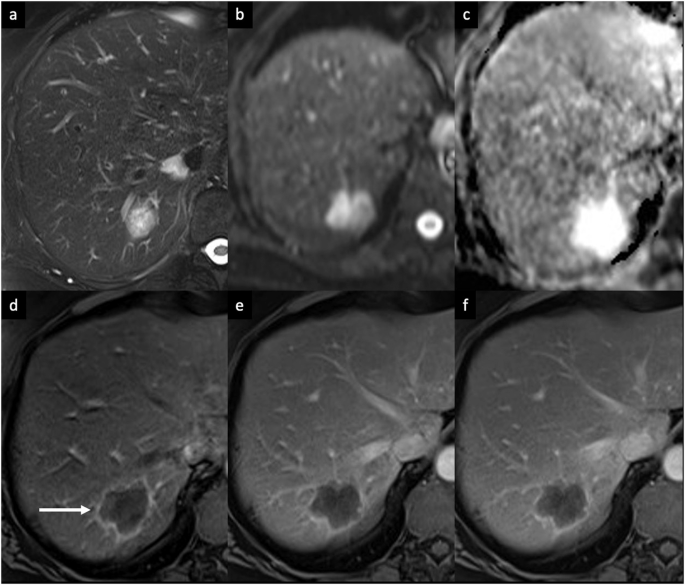
Sclerosed hemangioma in a 71-year-old woman who presented with abdominal pain and inflammatory syndrome. a Axial T2-weighted MRI shows a focal liver lesion in the right lobe with increased SI, with a hyperintense signal on diffusion-weighted imaging (b) but with high intensity on the ADC map (c). Extracellular contrast agent-enhanced MRI demonstrates a rim APHE (arrow) (d) that persisted and minimally increased on portal venous (e) and delayed phases (f). A biopsy of the lesion confirmed the diagnosis of sclerosed hemangioma
Infectious
Abscess
Abscesses can result from hematogenous dissemination of gastrointestinal infections via the portal vein or disseminated sepsis via the hepatic artery [11,12,13]. Bile infection, favored by duct obstruction from various etiologies, including stones, neoplasms, and strictures, is another frequent source of infection. Biliary stents and biliary-enteric anastomosis are also iatrogenic predisposing factors for pyogenic liver abscesses [11,12,13]. Hepatic infection by continuity, such as hepatic abscess from cholecystitis or direct introduction of bacteria into the liver parenchyma (during hepatic biopsy or surgery), and superinfection of pre-existing hepatic lesions, are other routes of liver abscesses [12, 13]. The clinical presentation includes fever, abdominal pain, nausea, leukocytosis, slightly elevated total bilirubin and aminotransferase levels, and hypoalbuminemia. On contrast-enhanced CT, pyogenic abscesses appear as single or multiple well-defined, hypoattenuating round lesions, ranging from a few millimeters (microabscesses) to several centimeters (macro abscesses), surrounded by a capsule [14]. The key imaging findings of large macro-abscesses are the layered-wall appearance, and they show an early inner wall rim APHE that persists in the DPs with a progressive delayed enhancement of the outer layer (“double target sign”); the entire lesion is often surrounded by segmental geographic or peripheral transient perfusion disorders, identified as regions with APHE that fade on PVP and DP [14,15,16]. The cluster sign is typical in abscesses of biliary origin and appears as multiple small hypoattenuating lesions with rim APHE that sometimes coalesce into larger lesions [14,15,16]. On MRI, abscesses show a central low SI on T1-WI and a central high SI on T2-WI, although the SI may vary depending on the proteinaceous content. The double target sign on MRI is represented by an iso- to hypointense inner layer and a hyperintense outer layer on T2-WI, with high SI of perilesional edema. Diffusion-weighted imaging (DWI) shows hyperintensity on high b-values and hypointensity on the ADC map [11,12,13,14]. The appearance of a pyogenic abscess on imaging is nearly indistinguishable from that of an amebic abscess. However, a solitary abscess is more likely to be amebic rather than pyogenic (Fig. 3) [15]. Although pyogenic abscesses usually appear to be fluid collections, they may also have a more solid appearance, mimicking primary or secondary hepatic tumors, such as intrahepatic cholangiocarcinoma (iCCA) or desmoplastic adenocarcinoma metastases. Areas of segmental or persistent rim enhancement at the periphery, perilesional edema surrounding organized abscesses, or associated findings of malignancy (capsular retraction, biliary duct dilatation, or lobar or segmental atrophy), are helpful additional imaging features that may help narrow the differential diagnosis between these entities [16, 17]. In some cases, aspiration/biopsy is needed to confirm the diagnosis [16, 17].

Amebic liver abscess in a 68-year-old man who presented with fever and right upper quadrant pain. Contrast-enhanced MRI using an extracellular contrast shows a large focal liver lesion, with (a) high SI on T2-weighted images, showing a “double target sign” with an iso- to hypointense inner layer and a hyperintense outer layer on T2-WI. The lesion shows (b) high SI on DWI (b = 800), (c) a peripheral low signal on the ADC map. d On the AP, the lesion demonstrates a thin-rim APHE, that persists (e) on the portal venous and (f) delayed phases
Alveolar echinococcosis
Echinococcus multilocularis is responsible for the rare alveolar echinococcosis. Alveolar echinococcosis occurs by either ingesting food or plants containing the eggs from the Echinococcus tapeworm or by direct contact with the definitive hosts, foxes [14, 18]. The liver is the most common site of infection (> 90% of patients). The lesion may be single or may appear as small, multilocular confluent heterogeneous cysts associated with solid components that demonstrate exogenous growth invading the adjacent hepatic parenchyma; a large cystic component is also frequently observed [18]. CT and MRI typically show multiple irregular, ill-defined lesions containing hypoattenuating areas of necrosis and active parasitic tissue hypoattenuating on CT and hyperintense on T2-WI on MRI, which show mild rim APHE or no contrast enhancement of the solid component [19]. The key imaging finding is the coalescence of multiple small cystic lesions in a single larger cavity (“cluster sign”) (Fig. 4). Hilar infiltration is common and results in dilatation of the intrahepatic bile ducts and invasion of the portal and hepatic veins, with subsequent atrophy of the affected liver segments due to hypoperfusion [18, 19].

Alveolar echinococcosis in a 61-year-old man who presented with right upper quadrant pain and hypereosinophilia. a Contrast-enhanced CT shows a subcapsular exophytic liver lesion in the right hepatic lobe, containing hypoattenuating areas of necrosis and thin-rim APHE. On post-contrast MRI using an extracellular contrast agent, the lesion shows (b) a rim APHE (arrow) that persisted on (c) portal venous phases. d On axial T2-weighted MRI, the lesion appears slightly hyperintense, with the coalescence of multiple small cystic lesions (arrowheads) in a single larger cavity (“cluster sign”)
Inflammatory
Granulomatous diseases
Granulomatous hepatitis is an inflammatory liver disease associated with granuloma formation in the liver, and it is associated most commonly with sarcoidosis, tuberculosis, and histoplasmosis [20]. On contrast-enhanced imaging, these granulomatous diseases may occasionally present with multiple small hypoattenuating lesions showing subtle rim APHE. On MRI, the lesions are hypointense on T1-WI and hypo-to-isointense on T2-WI [20, 21]. Because of these relatively nonspecific findings, percutaneous liver biopsy is often performed for the definitive diagnosis.
Solitary necrotic nodule
A solitary necrotic nodule of the liver is a rare benign lesion that might result from previous trauma, sequelae of previous parasite infection, or sclerosed hemangiomas [22]. This entity usually appears as a small solitary nodule, mainly found adjacent to the liver capsule of the right lobe. Imaging findings may depend on the natural history of the lesion [23]. Early in their development, the lesions may show hypoattenuation on unenhanced CT, low SI on T1-WI, hypo-to-isointense on T2-WI surrounded by a hyperintense halo, with rim APHE, and thin delayed rim enhancement (Fig. 5). At a later stage, key findings include reduced size, calcifications, low SI on both T1-WI and T2-WI, the complete lack of enhancement (due to intralesional necrosis), and variable amounts of intralesional hemorrhage [22, 23]. The differential diagnosis includes solitary metastasis and might require a percutaneous biopsy for confirmation [23].

Solitary necrotic nodule in a 52-year-old man. Extracellular contrast agent-enhanced MRI shows a subcapsular lesion in the right hepatic lobe, (a) slightly hyperintense on T2-weighted images, (b) high SI on DWI, and (c) with high values on ADC map. d The lesion demonstrates a rim APHE that persisted on portal venous (e) and delayed (f) phases. A biopsy of the lesion confirmed the diagnosis of a solitary necrotic nodule in the context of homogenous and moderate hepatic steatosis
Vascular
Epithelioid hemangioendothelioma (EHE)
EHE is a rare vascular malignancy of mesenchymal origin [24]. The etiology is unknown; however, possible etiologic factors have been suggested, such as exposure to vinyl chloride, occupational contaminants, major trauma to the liver, and viral hepatitis [25]. Patients often have nonspecific symptoms; one-third of them have extrahepatic lesions at the initial diagnosis [24,25,26]. Tumor marker levels are usually within normal limits [24,25,26]. Typical imaging appearance includes multiple hypoattenuating nodules on unenhanced CT, ranging from 0.5 cm to 10 cm in diameter, that frequently coalesce and form larger confluent masses, with a propensity to involve the peripheral regions of the liver and to extend to the liver margin. Nonspecific findings, such as retraction of the liver capsule and intralesional calcifications, may be present [24,25,26]. Contrast-enhanced dynamic imaging shows nodular or irregular rim APHE followed by progressive enhancement of the central fibrous stroma on PVP and DP (“black target sign”) in 86.7% of cases [27] (Fig. 6). Some lesions are surrounded by a thin, non-enhancing hypodense rim caused by tumor invasion of hepatic sinusoids, venules, and small portal vein branches. On MRI, EHE shows heterogeneous low SI on T1-WI, moderately hyperintense peripheral rim and a markedly hyperintense central area on T2-WI, and a peripheral rim of high SI on DWI (“targetoid appearance”) [24,25,26]. Central areas of reduced SI may correspond to hemorrhage, coagulation necrosis, and calcifications [24,25,26]. Because EHE has the tendency to spread within the portal and hepatic vein branches, another specific finding is the “lollipop sign”, a combination of the well-defined tumor mass on enhanced images (the candy in the lollipop) and the adjacent occluded vein (the stick) [28]. Those signs are specific findings of HEH but they can also be seen in other entities, such as iCCA, abscesses, and liver metastases from various primary cancers (i.e., breast and colon cancer). In this context, key differentiating features are the peripheral location of the nodules, the capsular retraction, and the tendency to show coalescent multiple lesions. The definitive diagnosis requires histopathologic confirmation [25].

EHE in a 66-year-old woman. a, c Contrast-enhanced CT shows multiple liver lesions with nodular or irregular rim APHE (arrows) with (b, d) gradual enhancement on the portal venous phase. The lesions predominate in the peripheral regions of the liver (subcapsular). Note, the minimal retraction of the liver capsule (b, arrowheads). A biopsy of the liver confirmed the diagnosis of EHE
Malignant
iCCA
iCCA is the most common primary non-HCC malignancy in the liver and it manifests with different morphological types and growth patterns [29]. The mass-forming type is the most common form of iCCA [29]. It classically manifests as a large lesion with irregular lobulated margins, rim APHE, progressive centripetal enhancement, and peripheral washout on PVP and DP [29, 30]. This enhancement pattern reflects the histology of the tumor, with viable tumor cells usually located at the periphery, with a central portion composed of a desmoplastic and hypovascularized tumor stroma with fibrosis and coagulative necrosis [31,32,33]. Other common imaging findings include capsular retraction, dilatation and thickening of the intrahepatic bile ducts around the tumor, vascular encasement by the tumor (but intravascular tumor invasion is rare), satellite nodules, intrahepatic metastases, and obliteration of the portal vein [33, 34]. On MRI, iCCA shows low-to-moderate SI on T2-WI and low SI on T1-WI [31,32,33]. iCCA may show the “necrosis imaging sign” as a persistent, nonenhancing defect with either high SI or low SI on the T2-WI. DWI demonstrates a target appearance on high b-value images (a central darker area due to fibrosis with peripheral hyperintense area) associated with peripheral hypointensity and central hyperintensity on the ADC map [31,32,33,34]. This “targetoid appearance” is also seen on the HBP of Gd-EOB-MRI, which indicates peripheral rim hypointensity and central cloud-like hyperintensity due to retained contrast material in the fibrotic stroma (“EOB-cloud enhancement”) (Fig. 7) [31,32,33,34,35]. Table 1 summarizes the main imaging features to differentiate mass-forming iCCA from its potential mimickers. Approximately 80% of scirrhous HCCs also showed the targetoid appearance on HBP [36], and the presence of T2 central darkness, a capsule, and septa on MRI are statistically significant features of scirrhous HCCs in comparison with ICCs [37]. The mucinous subtype of iCCA may show marked hyperintensity on T2-WI and centripetal enhancement pattern, but it should be distinguished from a hemangioma based on its continuous ragged peripheral enhancement, as opposed to the discontinuous nodular enhancement of the latter [38]. In iCCA, a rim APHE is the most frequently observed and sensitive LR-M feature (56.5–82.8%), followed by targetoid HBP on Gd-EOB-MRI (25.9–43.5%) and delayed central enhancement (24.2%) [39,40,41]. In assessing patients with LR-M lesions, serum tumor markers such as CA 19-9 may help diagnose iCCA [42]. The final diagnosis of LR-M observations requires histopathologic confirmation before treatment [39,40,41,42].

Intrahepatic mass-forming cholangiocarcinoma in a 62-year-old woman. a Axial T1-weighted in-phase and (b) opposed-phase MR images show a large lobulated hypointense mass, (c) with high SI on DWI (b = 800), (d) slightly hyperintense on fat-suppressed T2-weighted images, with associated capsular retraction. e Extracellular contrast agent-enhanced MRI sequences demonstrate a thick irregular rim APHE (arrowheads), (f) with progressive central enhancement on DP
HCC
HCC is the leading cause of cancer-related mortality in patients with chronic liver disease [43]. Approximately 90% of HCCs are associated with a known underlying etiology, most frequently chronic viral hepatitis (B and C), metabolic dysfunction-associated steatotic liver disease, and alcohol intake [43]. There are widely varying appearances of HCC on imaging. In noncirrhotic patients, HCC usually manifests as a large solitary mass (> 4 cm) that shows necrosis and central scar formation more frequently than in HCC developed in cirrhotic patients [44]. On dynamic CT and MRI, HCC typically shows the combination of nonrim APHE and nonperipheral washout on PVP or DP. The LI-RADS system also integrates the use of other imaging features, such as the presence of tumor-enhancing capsule, size, and significant tumor growth over time (> 50% in 6 months or less) [2, 45, 46]. However, some HCCs displaying an atypical enhancement pattern of peripheral rim APHE were reported in 5.6–15.7% of cases (HCCs with fibrotic components, poorly differentiated HCCs, sarcomatoid and scirrhous/sclerosing subtypes, HCCs with vessel encapsulating tumor clusters, or HCCs displaying progenitor cell markers) [47,48,49,50] (Fig. 8). The status of the patient (i.e., LI-RADS high risk of HCC or not) and the presence of other imaging ancillary features that favor the diagnosis of HCC, such as nonenhancing capsule, mosaic architecture, nodule-in-nodule architecture, intralesional fat, intralesional hemorrhage may guide the radiologists towards a diagnosis of HCC [2, 45, 51].

HCC and cavernous hemangioma in a 45-year-old man. a Axial T2-weighted MRI shows a subcapsular lesion with slightly high SI (arrow), with high SI on (b) DWI and low values on (c) the ADC map. d On gadobenate dimeglumine-enhanced MR sequences, the lesion shows a rim arterial phase enhancement (arrow), (e) capsule appearance in the delayed phase, and (f) low SI in the hepatobiliary phase, suggestive of HCC. Contrast-enhanced MRI also shows a large lobulated mass located in the right hepatic lobe, with high SI on (a) T2-weighted images, (b, c) without diffusion restriction, and with peripheral discontinuous nodular enhancement on (d) AP (arrowheads), followed by progressive centripetal enhancement on (e) DP (cavernous hemangioma)
Fibrolamellar hepatocellular carcinoma (FLC)
FLC is a very rare form of primary hepatic cancer, accounting for approximately 1% of all HCCs [52]. This tumor subtype occurs in young adults (second or third decade of life) without underlying hepatitis or cirrhosis (95% of cases) [53, 54]. FLC shows unique molecular oncogenic abnormalities with DNAJB1–PRKACA translocations. Patients frequently present with abdominal pain, malaise, weight loss, or a palpable abdominal mass or hepatomegaly; liver function tests may be normal or mildly elevated, and serum alpha-fetoprotein (AFP) is useless as a tumor marker [52,53,54]. Fibrolamellar HCC appears as a solitary, well-defined, large heterogeneous lesion with a lobulated surface and frequent central calcification [55]. On dynamic contrast-enhanced scans, FLC shows low attenuation compared with the surrounding liver, with thick rim APHE and variable enhancement pattern in PVP and DP; the fibrous central area and radial septa usually show delayed enhancement [55, 56]. Nodal metastases are common and occur in up to 50–65% of cases, most commonly seen at the hepatic hilum and hepatoduodenal ligament [57]. On MRI, the tumor is usually hypointense on T1-WI and hyperintense on T2-WI, with a central fibrous area that shows low SI on both T1-WI and T2-WI as well as low SI on the HBP of Gd-EOB-MRI (Fig. 9) [55,56,57]. The most common differential diagnosis is focal nodular hyperplasia, but the imaging features can overlap with those of other hyperenhancing lesions with central areas, including hepatocellular adenoma, hemangioma, metastases, and iCCA (Table 2). A biopsy may be required if there is any doubt in the diagnosis [55,56,57].

FLC in a 29-year-old woman. a Axial T2-weighted MR sequences show a mildly hyperintense heterogeneous mass in the left liver lobe, containing a T2-hypointense central scar, (b) with a targetoid appearance on an ADC map. c Extracellular contrast-enhanced AP image shows heterogeneous enhancement within the mass. d Axial contrast-enhanced AP CT demonstrates heterogeneous enhancement with typical central calcification (arrow). e, f Contrast-enhanced CT imaging performed after two years of a surgical tumor resection shows multiple tumor recurrences on the right hepatic lobe with rim APHE (arrows)
Combined hepatocellular-cholangiocarcinoma (cHCC-CCA) tumor
cHCC-CCA is a rare primary liver cancer composed of elements from both histological entities, with a reported incidence of less than 1% among all primary liver cancers [58]. cHCC-CCA mainly develops in patients with chronic liver disease or cirrhosis [58, 59]. Laboratory findings include possible elevated levels of AFP and CA 19-9. The characteristics of cHCC-CCA depend on the proportions of tumor components, showing a mixture of both HCC and iCCA imaging features. On contrast-enhanced CT, cHCC-CCA appears as a hypoattenuating or isoattenuating lesion, with a variable pattern of enhancement: early peripheral rim APHE with central hyperenhancement and peripheral washout on the DP (concentric zones of HCC peripherally and CCA centrally), diffuse early APHE and washout and capsule on DP (classical hallmarks of HCC observed in a minority of cases) (Fig. 10) [60, 61]. On MRI, cHCC-CCA shows low SI on T1-WI, heterogeneous hyperintensity on T2-WI with or without central hypointense focus (central CCA or fibrotic component), and diffusion restriction on DWI. Targetoid appearance on the HBP of Gd-EOB-MRI, capsular retraction, bile duct dilatation, and lymph nodes are more suggestive of CCA-like lesions; venous invasion is typical of HCC-like lesions [60, 61]. According to the LI-RADSv2018, targetoid appearance suggests non-HCC malignancy but does not exclude HCC, and cHCC-CCA should be categorized as LR-M [2]. The association of HCC features with CCA features (appearance of iCCA with portal venous invasion, or appearance of HCC with biliary dilation or enlarged lymph nodes) may guide the diagnosis. Furthermore, in a liver without underlying disease, the differential diagnosis would include hepatocellular adenoma, FNH, and hyperenhancing metastasis. The combined interpretation of imaging features and biopsy offers better diagnostic performance of cHCC‐CCA and may be helpful to narrow differential diagnosis [62].

cHCC-CCA tumor in a 55-year-old man with hepatitis C-related cirrhosis. a Gadoxetate disodium magnetic MRI shows a heterogeneous hyperintense lesion on fat-suppressed T2-weighted images, (b) high SI on DWI, (c) contrast-enhanced T1-weighted images demonstrate an irregular rim APHE (arrowheads), and (d) low SI on hepatobiliary phase acquired 20 min after administration of hepatobiliary contrast agent. e On the hepatobiliary phase 2 h after administration of gadobenate dimeglumine, the periphery of the lesion is hypointense, while the central fibrotic areas show high SI (“targetoid appearance”). A biopsy of the liver confirmed the diagnosis of cHCC-CCA
Primary hepatic lymphoma (PHL)
PHL is a rare form of lymphoproliferative disorder confined to the liver and perihepatic nodal sites without distant lymphomatous involvement at patient presentation [63]. PHL is commonly associated with viral hepatitis B and C and Epstein–Barr virus, and most patients present with right upper quadrant pain or jaundice, while fever and weight loss are found in about one-third of patients [63]. PHL may manifest at imaging as a solitary focal liver lesion, multiple lesions, a diffuse infiltration, or an ill-defined mass in the porta hepatis [63, 64]. The most common imaging manifestation is a heterogeneous solitary lesion with soft-tissue attenuation, poorly enhancing, or a rim APHE [63, 64]. The lesions typically show vascular or biliary encasement without thrombosis or ductal and vessel dilatation/distortion (“vessel-penetrating sign”) [63, 64]. On MRI, the nodules tend to be hypo- or isointense on T1-WI, moderately hyperintense on T2-WI, or may show a “target appearance”, markedly restricted diffusion on DWI, and with low SI on HBP [65]. PHL has a wide range of differential diagnoses and can mimic many conditions, such as iCCA, HCC, inflammatory pseudotumor, primary hepatic neuroendocrine tumor, liver infections, and metastases. A definitive diagnosis by imaging remains a challenge, and a definitive diagnosis can often be achieved only through histopathologic examination.
Metastases
The liver is one of the most common sites of metastases, and liver metastases are more common than primary liver cancers [66]. Liver metastases are broadly classified as hypoenhancing and hyperenhancing relative to the liver parenchyma in the AP [66]. Among hypoenhancing metastases, adenocarcinoma from the gastrointestinal tract (colorectum, stomach, pancreas, and biliary system) is the most frequent source, while hyperenhancing metastases typically originate from neuroendocrine tumors, renal cell carcinoma, thyroid carcinoma, choriocarcinoma, pheochromocytoma, or soft-tissue sarcomas [66,67,68]. A large number of other malignant tumors from almost any site, e.g., gastrointestinal stromal tumor, malignant melanoma, and lymphoma, can metastasize to the liver [66,67,68]. In diagnosing liver metastases, several characteristic imaging findings need to be considered, such as tumor vascularity, attenuation values and signal intensities, and growth patterns. On contrast-enhanced CT and MRI, rim APHE has been recognized as one of the characteristic findings of hepatic metastases [67,68,69,70]. Hypoenhancing metastases tend to show an early appearance of rim APHE, while hyperenhancing ones show more delayed rim enhancement. On MRI, the use of hepatobiliary contrast agents, especially the combined image analysis using the Gd-EOB-MRI with HBP and DWI, yields better diagnostic performance and offers a higher sensitivity for detecting small liver metastases compared to contrast-enhanced CT or extracellular agents MRI [67,68,69,70]. Metastases are hypointense on HBP due to their lack of functional hepatocytes. However, metastases may occasionally demonstrate central areas of relative hyperintensity on HBP (described as “EOB-cloud enhancement” similar to cholangiocarcinoma) compared to surrounding lesion hypointensity, resulting in a target appearance (peripheral hypointense rim compared to central cloud of enhancement) [70, 71]; this finding represents a paradoxical uptake of gadoxetic acid in the central area of lesion owing to accumulation of contrast in fibrotic tissue, such in cases of metastases from colorectal and breast cancers [71]. Recognizing the characteristic imaging features of different liver metastases from various primary malignancies, considering also the patient history and the need for liver biopsy if no primary tumor is known with immunohistochemistry, is essential because treatment strategies can differ according to the primary tumor (Table 3) (Fig. 11).

Synchronous liver metastasis from invasive ductal carcinoma of the breast in a 47-year-old woman. a Axial fat-suppressed T2-weighted MRI shows a large focal liver lesion with a central fibrotic component, depicted as an area of hyperintensity, whereas peripheral viable tumor is depicted as an area of moderate hyperintensity; this contrast between the peripheral and central areas is described as the so-called “target sign”. b Gadoxetate disodium-enhanced MRI demonstrates a rim APHE surrounding a central hypointense area. c The hepatobiliary phase shows a “cloud-like” appearance with a central portion that is relatively hyperintense compared to the hypointense peripheral area (“targetoid appearance”). A biopsy of the lesions confirmed the diagnosis of liver metastases from breast cancer
Post-treatment viable tumor and non-tumoral changes
After different locoregional treatments, such as radiofrequency ablation, microwave ablation, transarterial chemoembolization, and transarterial radioembolization, patients undergo multiphasic imaging to assess treatment response and to identify potential sites of progressive tumors elsewhere in the liver [72]. Recurrent or residual tumors may have a variety of imaging appearances. A complete lack of internal enhancement in treated tumors indicating complete tumor necrosis (rarely present at immediate postprocedural imaging) is classified as “LR-TR Nonviable” by the LI-RADS treatment response algorithm [72]. The presence of peripheral nodular or irregular rim enhancement should be classified as “LR-TR Viable” [2]. A well-described normal post-treatment finding is a smooth, thin, continuous rim APHE surrounding the treated zone without washout, usually corresponding to inflammation [72, 73]. This finding usually disappears within one month but may persist longer. Geographic APHE in the hepatic parenchyma adjacent or peripheral to the treatment zone is a normal finding that usually disappears 3–6 months after ablation [72, 73]. The key imaging features that suggest residual or recurrent tumor are an irregular, thickened, nodular, or mass-like APHE within or around the treated zone or the disruption of a smooth continuous peripheral rim enhancement, especially if it is not decreasing in size over time (Fig. 12) [72, 73]. Additionally, lack of washout and absence of mass-like T2-WI or DWI signal abnormality are helpful in differentiating benign post-treatment parenchymal enhancement from recurrent disease. At initial imaging after transarterial chemoembolization treatment, a completely treated tumor will usually be similar in size to the tumor at pretreatment imaging, and it becomes immediately nonenhancing, similar to thermal ablation [72, 73]. Postprocedural hemorrhage, inflammation, and liquefactive necrosis can also be present in the treatment zone and may result in a temporary increase in the size of the treated tumor [72, 73]. Similar to thermal ablation, there is commonly an inflammatory thin, continuous, smooth rim APHE surrounding an effectively treated tumor that may persist for more than one year; any associated thickening or nodularity should raise suspicion for viable tumor [72, 73]. Prior studies have suggested that radiomics analysis based on PVP and HBP of gadoxetate disodium-enhanced MRI may also be helpful in predicting response in HCCs treated with TAE [74]. Unlike ablation and transarterial chemoembolization, tumor necrosis after transarterial radioembolization is not immediate, and a persistent intratumoral enhancement (diffuse or nodular, central or peripheral) with or without washout or capsule may be seen in the first few months after treatment, even if the mass is completely treated [72, 73, 75, 76]. Peritumoral thin ring APHE without asymmetry, nodular morphology is a benign finding related to inflammation or parenchymal fibrosis that may persist for months after treatment [72, 73, 75, 76].

Multinodular tumor recurrence of iCCA in a 49-year-old woman. CT performed after local-regional treatment (transarterial radioembolization) demonstrates multinodular tumor recurrence around the treated zone showing irregular, thickened, nodular rim APHE (a, arrows) which persisted and increased (b) on DP (arrow)
In conclusion, a broad spectrum of focal liver lesions may show rim APHE on dynamic imaging as a typical or an atypical presentation. The nature of benign and malignant liver lesions with rim APHE is variable and includes vascular, infectious, inflammatory, biliary, hepatocellular, and secondary neoplastic origin. The differential diagnosis at imaging is based on clinical characteristics, laboratory tests, and imaging findings. Histopathological examination may be required in selected cases.
Abbreviations
- ADC:
-
Apparent diffusion coefficient
- AFP:
-
Alpha-fetoprotein
- AP:
-
Arterial phase
- APHE:
-
Arterial phase hyperenhancement
- cHCC-CCA:
-
Combined hepatocellular-cholangiocarcinoma
- DP:
-
Delayed phase
- DWI:
-
Diffusion-weighted imaging
- EHE:
-
Epithelioid hemangioendothelioma
- FLC:
-
Fibrolamellar hepatocellular carcinoma
- Gd-EOB-MRI:
-
Gadoxetate disodium-enhanced magnetic resonance imaging
- HCC:
-
Hepatocellular carcinoma
- iCCA:
-
Intrahepatic cholangiocarcinoma
- LI-RADSv2018:
-
Liver Imaging Reporting And Data System version 2018
- PHL:
-
Primary hepatic lymphoma
- PVP:
-
Portal venous phase
- WI:
-
Weighted imaging
References
Consul N, Sirlin CB, Chernyak V et al (2021) Imaging features at the periphery: hemodynamics, pathophysiology, and effect on LI-RADS categorization. Radiographics 41:1657–1675
American College of Radiology (2023) CT/MR Liver Imaging Reporting and Data System version 2018. Available via https://www.acr.org/Clinical-Resources/Reporting-and-Data-Systems/LI-RADS/CT-MRI-LI-RADS-v2018. Accessed 20 Dec 2023
Kim YY, Choi JY, Sirlin CB, An C, Kim MJ (2019) Pitfalls and problems to be solved in the diagnostic CT/MRI Liver Imaging Reporting and Data System (LI-RADS). Eur Radiol 29:1124–1132
Vernuccio F, Ronot M, Dioguardi Burgio M et al (2017) Uncommon evolutions and complications of common benign liver lesions. Abdom Radiol (NY) 43:2075–2096
Vernuccio F, Cannella R, Porrello G et al (2019) Uncommon imaging evolutions of focal liver lesions in cirrhosis. Abdom Radiol (NY) 44:3069–3077
Shin N, Choi JA, Choi JM et al (2020) Sclerotic changes of cavernous hemangioma in the cirrhotic liver: long-term follow-up using dynamic contrast-enhanced computed tomography. Radiol Med 125:1225–1232
Vilgrain V, Boulos L, Vullierme M-P et al (2000) Imaging of atypical hemangiomas of the liver with pathologic correlation. Radiographics 20:379–397
Doyle DJ, Khalili K, Guindi M, Atri M (2007) Imaging features of sclerosed hemangioma. AJR Am J Roentgenol 189:67–72
Miyata T, Beppu T, Kuramoto K et al (2018) Hepatic sclerosed hemangioma with special attention to diffusion-weighted magnetic resonance imaging. Surgical Case Rep. 4:3
Oto A, Kulkarni K, Nishikawa R, Baron RL (2010) Contrast enhancement of hepatic hemangiomas on multiphase MDCT: Can we diagnose hepatic hemangiomas by comparing enhancement with blood pool? AJR Am J Roentgenol 195:381–386
Mortelé KJ, Segatto E, Ros PR (2004) The infected liver: radiologic-pathologic correlation. Radiographics 24:937–955. https://doi.org/10.1148/rg.244035719
Czerwonko ME, Huespe P, Bertone S et al (2016) Pyogenic liver abscess: current status and predictive factors for recurrence and mortality of first episodes. HPB (Oxford) 18:1023–1030
Shi SJ, Zhai ZL, Zheng SS (2018) Pyogenic liver abscess of biliary origin: the existing problems and their strategies. Semin Liver Dis 38:270–283
Malekzadeh S, Widmer L, Salahshour F et al (2021) Typical imaging finding of hepatic infections: a pictorial essay. Abdom Radiol (NY) 46:544–561
Dauny V, Dioguardi-Burgio M, Leflon-Guibout V et al (2023) Clinical and radiological differences between amoebic and pyogenic liver abscess: a case-control study. Rev Med Interne 44:472–478
Bächler B, Baladron MJ, Menias C et al (2016) Multimodality imaging of liver infections: differential diagnosis and potential pitfalls. Radiographics 36:1001–1023
Matthieu D, Vasile N, Fagniez PL et al (2985) Dynamic CT features of hepatic abscesses. Radiology 154:749–752
Marrone G, Crino F, Caruso S et al (2012) Multidisciplinary imaging of liver hydatidosis. World J Gastroenterol 18:1438–1447
Kodama Y, Fujita N, Shimizu T et al (2003) Alveolar echinococcosis: MR findings in the liver. Radiology 228:172–177
Kakkar C, Polnaya AM, Koteshwara P et al (2015) Hepatic tuberculosis: a multimodality imaging review. Insight Imaging 6:647–658
Karaosmanoglu AD, Onur MR, Sahani DV, Tabari A, Karcaaltincaba M (2016) Hepatobiliary tuberculosis: imaging findings. AJR Am J Roentgenol 207:694–704
Colagrande S, Paolucci ML, Messerini L et al (2008) Solitary necrotic nodules of the liver: cross-sectional imaging findings and follow-up in nine patients. AJR Am J Roentgenol 191:1122–1128
Geng L, Lin C, Huang B et al (2012) Solitary necrotic nodule of the liver: MR findings in 33 pathologically proved lesions. Eur J Radiol 81:623–629
Zhou L, Cui MY, Xiong J et al (2015) Spectrum of appearances on CT and MRI of hepatic epithelioid hemangioendothelioma. BMC Gastroenterol 15:69
Makhlouf HR, Ishak KG, Goodman ZD (1999) Epithelioid hemangioendothelioma of the liver: a clinicopathologic study of 137 cases. Cancer 85:562–582
Bruegel M, Muenzel D, Waldt S, Specht K, Rummeny EJ (2011) Hepatic epithelioid hemangioendothelioma: findings at CT and MRI including preliminary observations at diffusion-weighted echo-planar imaging. Abdom Imaging 36:415–424
Luo L, Cai Z, Zeng S et al (2023) CT and MRI features of hepatic epithelioid haemangioendothelioma: a multi-institutional retrospective analysis of 15 cases and a literature review Insights Imaging 14:2. https://doi.org/10.1186/s13244-022-01344-y
Mamone G, Miraglia R (2019) The “Target sign” and the “Lollipop sign” in hepatic epithelioid hemangioendothelioma. Abdom Radiol (NY) 44:1617–1620
Chung YE, Kim M-J, Park YN et al (2009) Varying appearances of cholangiocarcinoma: radiologic-pathologic correlation. Radiographics 29:683–700. https://doi.org/10.1148/rg.293085729
Lacomis JM, Baron RL, Oliver JH, Nalesnik MA, Federle MP (1997) Cholangiocarcinoma: delayed CT contrast enhancement patterns. Radiology 203:98–104. https://doi.org/10.1148/radiology.203.1.9122423
Cannella R, Cunha GM, Catania R et al (2021) Magnetic resonance imaging of nonhepatocellular malignancies in chronic liver disease. Magn Reson Imaging Clin N Am 29:404–418
Cannella R, Fraum TJ, Ludwig DR et al (2021) Targetoid appearance on T2-weighted imaging and signs of tumor vascular involvement: diagnostic value for differentiating HCC from other primary liver carcinomas. Eur Radiol 31:6868–6878
Kang Y, Lee JM, Kim SH, Han JK, Choi BI (2012) Intrahepatic mass-forming cholangiocarcinoma: enhancement patterns on gadoxetic acid–enhanced MR images. Radiology 264:751–760. https://doi.org/10.1148/radiol.12112308
Koh J, Chung YE, Nahm JH et al (2016) Intrahepatic mass-forming cholangiocarcinoma: prognostic value of preoperative gadoxetic acid-enhanced MRI. Eur Radiol 26:407–416
Vernuccio F, Gagliano DS, Cannella R et al (2021) Spectrum of liver lesions hyperintense on hepatobiliary phase: an approach by clinical setting. Insights Imaging 12:8. https://doi.org/10.1186/s13244-020-00928-w
Park MJ, Kim YK, Park HJ, Hwang J, Lee WJ (2013) Scirrhous hepatocellular carcinoma on gadoxetic acid-enhanced magnetic resonance imaging and diffusion-weighted imaging: emphasis on the differentiation of intrahepatic cholangiocarcinoma. J Comput Assist Tomogr 37:872–881
Choi SY, Kim YK, Min JH et al (2018) Added value of ancillary imaging features for differentiating scirrhous hepatocellular carcinoma from intrahepatic cholangiocarcinoma on gadoxetic acid-enhanced MR imaging. Eur Radiol 28:2549–2560
Min JH, Kim YK, Choi S-Y et al (2019) Intrahepatic mass-forming cholangiocarcinoma: arterial enhancement patterns at MRI and prognosis. Radiology 290:691–699
Fowler KJ, Potretzke TA, Hope TA, Costa EA, Wilson SR (2018) LI-RADS M (LR-M): definite or probable malignancy, not specific for hepatocellular carcinoma. Abdom Radiol (NY) 43:149–157
Cunha GM, Fowler KJ, Roudenko A et al (2021) How to use LI-RADS to report liver CT and MRI observations. Radiographics 41:1352–1367
Kim MY, Joo I, Kang HJ et al (2020) LI-RADS M (LR-M) criteria and reporting algorithm of v2018: diagnostic values in the assessment of primary liver cancers on gadoxetic acid-enhanced MRI. Abdom Radiol (NY) 45:2440–2448
Jiang H, Song B, Qin Y et al (2021) Diagnosis of LI-RADS M lesions on gadoxetate-enhanced MRI: identifying cholangiocarcinoma-containing tumor with serum markers and imaging features. Eur Radiol 31:3638–3648
European Association for the Study of the Liver (2018) EASL clinical practice guidelines: management of hepatocellular carcinoma. J Hepatol 69:182–236
Brancatelli G, Federle MP, Grazioli L, Carr BI (2002) Hepatocellular carcinoma in noncirrhotic liver: CT, clinical, and pathologic findings in 39 U.S. residents. Radiology 222:89–94
Chernyak V, Fowler KJ, Kamaya A et al (2018) Liver Imaging Reporting and Data System (LI-RADS) version 2018: imaging of hepatocellular carcinoma in at-risk patients. Radiology 289:816–830
Ludwig DR, Fraum TJ, Cannella R et al (2019) Hepatocellular carcinoma (HCC) versus non-HCC: accuracy and reliability of Liver Imaging Reporting and Data System v2018. Abdom Radiol (NY) 44:2116–2132
Cannella R, Dioguardi Burgio M, Beaufrère A et al (2021) Imaging features of histological subtypes of hepatocellular carcinoma: implication for LI-RADS. JHEP Rep 3:100380
An C, Kim DW, Park YN et al (2015) Single hepatocellular carcinoma: preoperative MR imaging to predict early recurrence after curative resection. Radiology 276:433–443
Kawamura Y, Ikeda K, Seko Y et al (2011) Heterogeneous type 4 enhancement of hepatocellular carcinoma on dynamic CT is associated with tumor recurrence after radiofrequency ablation. AJR Am J Roentgenol 197:W665–W673
Rhee H, An C, Kim HY et al (2019) Hepatocellular carcinoma with irregular rim-like arterial phase hyperenhancement: more aggressive pathologic features. Liver Cancer 8:24–40
Cannella R, Vernuccio F, Antonucci M et al (2022) LI-RADS ancillary features favoring benignity: Is there a role in LR-5 observations? Eur Radiol 32:1804–1812
Ichikawa T, Federle MP, Grazioli L et al (1999) Fibrolamellar hepatocellular carcinoma: imaging and pathologic findings in 31 recent cases. Radiology 213:352–361
El-Serag HB, Davila JA (2004) Is fibrolamellar carcinoma different from hepatocellular carcinoma? A US population-based study. Hepatology 39:798–803
Craig JR, Peters RL, Edmondson HA, Omata M (1980) Fibrolamellar carcinoma of the liver: a tumor of adolescents and young adults with distinctive clinico-pathologic features. Cancer 46:372–379
Ganeshan D, Szklaruk J, Kundra V et al (2014) Imaging features of fibrolamellar hepatocellular carcinoma. AJR Am J Roentgenol 202:544–552
Palm V, Sheng R, Mayer P et al (2018) Imaging features of fibrolamellar hepatocellular carcinoma in gadoxetic acid-enhanced MRI. Cancer Imaging 18:9. https://doi.org/10.1186/s40644-018-0143-y
Ichikawa T, Federle MP, Grazioli L, Marsh W (2000) Fibrolamellar hepatocellular carcinoma: pre- and posttherapy evaluation with CT and MR imaging. Radiology 217:145–151
Brunt E, Aishima S, Clavien PA et al (2018) cHCC-CCA: consensus terminology for primary liver carcinomas with both hepatocytic and cholangiocytic differentation. Hepatology 68:113–126
Gigante E, Paradis V, Ronot M et al (2020) New insights into the pathophysiology and clinical care of rare primary liver cancers. JHEP Rep 3:100174
Fowler KJ, Sheybani A, Parker RA et al (2013) Combined hepatocellular and cholangiocarcinoma (biphenotypic) tumors: imaging features and diagnostic accuracy of contrast-enhanced CT and MRI. AJR Am J Roentgenol 201:332–339
Maximina S, Ganeshane DM, Shanbhogued AK et al (2014) Current update on combined hepatocellular-cholangiocarcinoma. Eur J Radiol Open 1:40–48. https://doi.org/10.1016/j.ejro.2014.07.001
Gigante E, Ronot M, Bertin C et al (2019) Combining imaging and tumour biopsy improves the diagnosis of combined hepatocellular-cholangiocarcinoma. Liver Int 39:2386–2396
Tomasian A, Sandrasegaran K, Elsayes KM et al (2015) Hematologic malignancies of the liver: spectrum of disease. Radiographics 35:71–86
Murakami J, Shimizu Y (2013) Hepatic manifestations in hematological disorders. Int J Hepatol 2013:484903
Colagrande S, Calistri L, Grazzini G et al (2018) MRI features of primary hepatic lymphoma. Abdom Radiol (NY) 43:2277–2287
Horn SR, Stoltzfus KC, Lehrer EJ et al (2020) Epidemiology of liver metastases. Cancer Epidemiol 67:101760
Ozaki K, Higuchi S, Kimura H, Gabata T (2022) Liver metastases: correlation between imaging features and pathomolecular environments. Radiographics 42:1994–2013
Semelka RC, Hussain SM, Marcos HB, Woosley JT (2000) Perilesional enhancement of hepatic metastases: correlation between MR imaging and histopathologic findings—initial observations. Radiology 215:89–94. 2000
Nakai H, Arizono S, Isoda H, Togashi K (2019) Imaging characteristics of liver metastases overlooked at contrast-enhanced CT. AJR Am J Roentgenol 212:782–787
Lee KH, Lee JM, Park JH et al (2013) MR imaging in patients with suspected liver metastases: value of liver-specific contrast agent gadoxetic acid. Korean J Radiol 14:894–904
Dioguardi Burgio M, Ronot M, Paulatto L et al (2016) Avoiding pitfalls in the interpretation of gadoxetic acid-enhanced magnetic resonance imaging. Semin Ultrasound CT MR 37:561–572
Mendiratta-Lala M, Masch WR, Shampain K et al (2020) MRI assessment of hepatocellular carcinoma after local-regional therapy: a comprehensive review. Radiol Imaging Cancer 2:1
Dioguardi Burgio M, Sartoris R, Libotean C et al (2019) Lipiodol retention pattern after TACE for HCC is a predictor for local progression in lesions with complete response. Cancer Imaging 19:75
Cannella R, Cammà C, Matteini F et al (2022) Radiomics analysis on gadoxetate disodium-enhanced MRI predicts response to transarterial embolization in patients with HCC. Diagnostics 12:1308
Salem R, Thurston KG (2006) Radioembolization with yttrium-90 microspheres: a state-of-the-art brachytherapy treatment for primary and secondary liver malignancies: part 3: comprehensive literature review and future direction. J Vasc Inter Radiol 17:1571–1593
Keppke AL, Salem R, Reddy D et al (2007) Imaging of hepatocellular carcinoma after treatment with yttrium-90 microspheres. AJR Am J Roentgenol 188:768–775
Funding
R.C.: co-funding by the European Union—FESR or FSE, PON Research and Innovation 2014–2020—DM 1062/2021.
Author information
Authors and Affiliations
Contributions
F.M., F.V., R.C., and G.B.: study concept and design. F.M., F.V., R.C., L.G., M.D.B., R.S., and M.R.: collecting data. F.M., F.V., and R.C.: manuscript preparation and literature research. F.M., R.C., L.G., M.D.B., R.S., G.B., V.V., M.R., and F.V.: manuscript editing. All authors read and approved the final manuscript.
Corresponding author
Ethics declarations
Ethics approval and consent to participate
Not applicable.
Consent for publication
Not applicable.
Competing interests
R.C.: support for attending meetings from Bracco and Bayer; research collaboration with Siemens Healthineers. R.C. is also a Section Editor (Social Media) for Insights into Imaging, he did not participate in the selection nor review processes for this article. F.V. is a member of the Scientific Editorial Board for Insights into Imaging, they did not participate in the selection nor review processes for this article. F.M., L.G., M.D.B., R.S., G.B., V.V., and M.R.: declare that they have no competing interests for this paper.
Additional information
Publisher’s Note Springer Nature remains neutral with regard to jurisdictional claims in published maps and institutional affiliations.
Rights and permissions
Open Access This article is licensed under a Creative Commons Attribution 4.0 International License, which permits use, sharing, adaptation, distribution and reproduction in any medium or format, as long as you give appropriate credit to the original author(s) and the source, provide a link to the Creative Commons licence, and indicate if changes were made. The images or other third party material in this article are included in the article’s Creative Commons licence, unless indicated otherwise in a credit line to the material. If material is not included in the article’s Creative Commons licence and your intended use is not permitted by statutory regulation or exceeds the permitted use, you will need to obtain permission directly from the copyright holder. To view a copy of this licence, visit http://creativecommons.org/licenses/by/4.0/.
About this article

Cite this article
Matteini, F., Cannella, R., Garzelli, L. et al. Benign and malignant focal liver lesions displaying rim arterial phase hyperenhancement on CT and MRI. Insights Imaging 15, 178 (2024). https://doi.org/10.1186/s13244-024-01756-y
Received:
Accepted:
Published:
DOI: https://doi.org/10.1186/s13244-024-01756-y