- Educational Review
- Open access
- Published:
O-RADS MRI risk stratification system: pearls and pitfalls
Insights into Imaging volume 15, Article number: 45 (2024)
Abstract
In 2021, the American College of Radiology (ACR) Ovarian-Adnexal Reporting and Data System (O-RADS) MRI Committee developed a risk stratification system and lexicon for assessing adnexal lesions using MRI. Like the BI-RADS classification, O-RADS MRI provides a standardized language for communication between radiologists and clinicians. It is essential for radiologists to be familiar with the O-RADS algorithmic approach to avoid misclassifications. Training, like that offered by International Ovarian Tumor Analysis (IOTA), is essential to ensure accurate and consistent application of the O-RADS MRI system. Tools such as the O-RADS MRI calculator aim to ensure an algorithmic approach. This review highlights the key teaching points, pearls, and pitfalls when using the O-RADS MRI risk stratification system.
Critical relevance statement This article highlights the pearls and pitfalls of using the O-RADS MRI scoring system in clinical practice.
Key points
• Solid tissue is described as displaying post- contrast enhancement.
• Endosalpingeal folds, fimbriated end of the tube, smooth wall, or septa are not solid tissue.
• Low-risk TIC has no shoulder or plateau. An intermediate-risk TIC has a shoulder and plateau, though the shoulder is less steep compared to outer myometrium.
Graphical Abstract

Introduction
In 2021, the American College of Radiology (ACR) Ovarian-Adnexal Reporting and Data Systems (O-RADS) MRI Committee created and introduced an evidence-based lexicon and risk stratification system for assessing adnexal lesions using MRI [1]. The O-RADS MRI scoring system evaluates the adnexal lesion’s MRI appearance and provides a numerical risk score from 1 to 5, with 0 indicating incomplete or uninterpretable imaging. In this system, the higher the risk score, the greater the risk of malignancy.
A clear benefit of the O-RADS MRI classification system, similar to the universally accepted ACR Breast Imaging Reporting and Data System classification is the adoption of a uniform and descriptive lexicon, which can facilitate communication between radiologists and referring physicians [2]. This was recently confirmed by a metaanalysis including 4520 adnexal lesions showing that O-RADS MRI had a sensitivity and specificity over 90% in characterizing adnexal lesions [3]. However, in a recent EURAD study, Thomassin-Naggara et al. highlighted several common errors in O-RADS MRI assessment and analyzed the reason for the misclassified cases [4]. Out of a total of 1502 lesions, 139 (9.2%) were misclassified. The primary reasons for misclassification were misinterpretation of solid tissue (n = 104) and errors in identifying the origin of the lesion (n = 35) [4]. The authors emphasized the need for radiologist training in O-RADS MRI, similar to the training offered by the International Ovarian Tumor Analysis (IOTA) group [5]. In addition, tools such as the recently implemented O-RADS MRI calculator (https://oradsmricalc.com) will help radiologists to adhere to the essential algorithmic approach. In this review, we highlight the pearls and pitfalls of using the O-RADS MRI scoring system in clinical practice.
Brief overview of O-RADS MRI
The ACR O-RADS MRI Committee has recently introduced an MRI lexicon and risk stratification system to assess adnexal lesions. This initiative aims to standardize image acquisition and reporting, ensuring a consistent reporting lexicon and improved agreement in image interpretation [1]. Notably, this lexicon resembles the ACR O-RADS ultrasound (US) lexicon and risk stratification system introduced by Andreotti et al. [6]. Developed through a modified Delphi process, the ACR O-RADS MRI lexicon comprises seven categories of descriptors agreed upon by imaging experts through consensus.[1]. The major lexicon categories include lesion shape or contour, signal intensity, type (cyst without or with a solid component, solid), fluid (simple, non-simple), solid component (solid tissue or non-solid tissue), and extra-ovarian findings [1].
Pearls and pitfalls
-
a.
Technical aspects
Acquisition pearls
Scheduling the exam according to menstrual cycle is not necessary. The main goal of patient preparation is to reduce motion artifacts and should include fasting (at least 3 h prior to the examination) and the use of an antiperistaltic agent (20 mg butylscopolamine or 1 mg of glucagon if not contraindicated).
Phased Array body coil should be used for image acquisition. The patient is imaged in the supine position and the following imaging sequences should be acquired though the pelvis for optimal adnexal lesion characterization (Fig. 1, Table 1):
-
Sagittal T2-weighted without fat saturation (slice thickness, ≤ 4 mm)
-
Axial T2-weighted without fat saturation (section thickness, ≤3 mm)
-
Axial unenhanced T1-weighted in-, opposed-phased, fat and water sequence (section thickness, ≤ 4 mm)
-
Axial abdo-pelvic DWI scan (section thickness 4–5 mm, low b-values: 0 or 50 − high b-value: 1000–1200)
-
Three-dimensional non-dynamic T1-weighted gadolinium sequence with fat sat (slice thickness 3 mm) without contrast
-
Three-dimensional dynamic contrast-enhanced (DCE) MRI T1-weighted sequence (if any enhancing solid tissue within the adnexal lesion): 3D axial (15 cm–15 s–3 mm)
-
Maximal slice thickness of 3 mm
-
Axial plane, in line with the T2-weighted sequence and DWI scan for ease of cross correlation of the signal characteristics
-
Minimum temporal resolution of 15 s per acquisition
-
Subtraction allows the suppression of any pre-contrast high T1-weighted signal intensity, whether the DCE is acquired with or without fat saturation.
-
The acquisition needs to start prior to contrast injection (10 s prior to contrast injection) and should continue for at least 3 min.
-
-
If DCE MRI is not feasible, an alternative option is to perform a T1WI series at 30–40 s post-contrast injection. It is important to note that this approach will have limitations in assessing adnexal lesions with enhancing solid tissue, which can only be categorized as O-RADS MRI 4 or 5.

Optimal MRI protocol to perform O-RADS MRI Risk scoring. a Sagittal T2-weighted sequence without fat saturation. b Axial T2-weighted lombo-pelvic sequence. c Axial DWI lombo-pelvic scan (b: 1400 s/mm2). d Corresponding axial ADC map. e Axial unenhanced T1-weighted in-phase. f Axial unenhanced T1-weighted opposed-phase. g Axial unenhanced T1-weighted Fat sequence. h Axial unenhanced T1-weighted water sequence. i Axial late-gadolinium T1-weighted sequence. j, k DCE T1-weighted sequence with myometrial curve (yellow curve) and region of interest within the solid ovarian tissue (blue curve) (l). This was classifified as an O-RADS MRI 4, and hypothesized to represent a serous borderline cystadenoma
Table 1 summarizes the O-RADS MRI protocol, the added value of each sequence, and pitfalls of acquisition.
-
b.
Interpretation
There are six risk score categories in the O-RADS MRI risk stratification system which are detailed below and in Fig. 2.

O-RADS classification with most common errors. Please refer to reference 7 for positive predictive values
O-RADS MRI score 0
Definition: Lesions that have undergone incomplete or inadequate MRI evaluation are included in this category. |
This category includes lesions that are partly imaged or imaged without intravenous contrast because the assessment of contrast enhancement is critical for risk stratification. It also includes situation where the recommended protocol was not followed.
O-RADS MRI score 1
Definition: Normal ovaries or ovaries with physiologic observations, such as a follicle, corpus luteum cyst, and hemorrhagic cyst measuring ≤ 3 cm in premenopausal women. |
Pitfall 1
This category emphasizes the key role that MRI plays in identifying the origin of the pelvic lesion. In the EURAD study, among 1194 patients referred for MRI, 64 (5.4%) patients did not have a pelvic lesion, and 130 (8.6%) had a non-adnexal lesion [4, 7]. Furthermore, twelve adnexal lesions were misclassified as non-adnexal, whereas three were classified as adnexal in origin but were in actuality non-adnexal lesion. Size contributed greatly to the misclassification as ten (83.3%) of the former 12 misclassified adnexal lesions were larger than 5 cm [4, 7]. These results illustrate the potential pitfall of this category, i.e., misdiagnosis of non-adnexal lesion versus adnexal lesion.
Pearls to correctly assess the origin of the lesion:
-
(1)
Identifying normal adnexa on the same side as the lesion can rule out adnexal origin. Diffusion-weighted imaging (DWI) can be helpful in identifying premenopausal ovaries that show moderately high signal intensity. One point worth noting is that in postmenopausal women, ovaries may be misdiagnosed as a lymph node due to absence of follicles. The location of ovaries internally to internal iliac vessels may help for the differentiation with obturator lymph node that are located externally. On the other hand, the absence of a normal ipsilateral adnexa around a lesion suggests that adnexal origin is likely [8, 9]. If normal ipsilateral adnexa are not found, it is important to evaluate the location and course of gonadal vessels [10, 11]. Typically, gonadal vessels are located anterior to the psoas muscles. If these vessels lead to the pelvic lesion, it is likely of adnexal origin.
-
(2)
When the lesion abuts normal adnexa, various imaging signs described previously can help assess the relationship between the lesion and adjacent organs [10] (Fig. 3).

Useful sign to evaluate the relationship between a lesion and adjacent organ: a Axial T2-weighted sequence with a “beak sign” (white arrow head). b Sagittal T2-weighted sequence showing a “claw sign” (white star). c, d Sagittal and Axial T2-weighted sequence with “bridging vessel sign” (arrow)
The “beak sign” is defined as sharp angles between the adnexa and the lesion, causing the edges of the ovary to deform into a beak shape. The presence of the beak sign suggests that the lesion originates from the ovary [10, 12]. The “bridging vessel” sign and “claw sign” are indicative of the lesion originating from the uterus. The bridging vessel sign refers to vessels extending between the uterus and the lesion, as observed in pedunculated uterine leiomyomas [13]. The “claw sign” corresponds to the uterine tissue draping over the lesion and is also typically observed in uterine leiomyomas [14]. |
Pitfall 2
An O-RADS MRI score of 1 includes physiological observations which must not be mistaken for a lesion. These physiologic observations include (1) Follicle, defined as a unilocular simple cyst ≤ 3 cm in premenopausal women and a (2) corpus luteum, a corpus luteum arises at the site of a follicle after ovum release and often shows a crenulated wall due to infoldings. Corpus luteum is characterized as a cyst ≤ 3 cm with a thick, enhancing wall and can be simple or contain hemorrhage [15].
Typically, corpus luteum cysts appear as hypointense on T1-weighted images (T1WI) and heteregeneously hyperintense on T2-weighted images (T2WI) with a thick, often crenulated wall showing high signal on diffusion-weighted imaging (DWI) and avid contrast enhancement [16, 17] (Fig. 4).

Example of MRI appearance of a corpus luteum cyst. a Axial T2-weighted sequence. b Axial DWI abdominal and pelvic scan (b: 1200 s/mm2). c Axial unenhanced T1-weighted water sequence. d Axial late-gadolinium T1-weighted sequence. Left ovarian corpus luteum cyst (maximal diameter: 35 mm) (white arrow)
There can be variations in the appearance of corpus luteum, such as T1 hyperintensity and variable signal intensity on T2WI due to internal blood products. Uncommon findings may include multifocality, bilaterality, and rupture. Rupture can lead to substantial hemoperitoneum, visible as heterogeneous or T1-weighted hyperintense ascites, along with a focal interruption of the cyst wall [16, 17].
Differential diagnosis of corpus luteum includes:
-
Endometrioma: Endometriomas are typically larger and demonstrate homogeneous T1-weighted hyperintensity and variable T2-weighted hypointensity (known as “T2 shading”), with a thin enhancing wall. Endometriomas result from chronic repetitive bleeding over multiple menstrual cycles, which is not observed with a corpus luteum [18,19,20].
-
Tubo-ovarian abscess: Tubo-ovarian abscesses are typically bilateral and asymmetrical (due to different degree of evolution of pelvic inflammatory disease). They usually demonstrate thick enhancing walls, tubular cystic components, and surrounding fatty infiltration/stranding. Pus induces a very high signal intensity on DWI and a low signal intensity on ADC map. Differentiation of tubo-ovarian abscess from corpus luteum is also based on clinical presentation. In addition to pelvic pain, patients with tubo-ovarian abscesses often have fever and elevated white cell count [21, 22].
Pitfall 3
Of note, a para-ovarian cyst is considered O-RADS MRI score 2 and not 1 as it is not a physiological lesion. Para-ovarian cysts originate from the mesosalpinx. Para-ovarian cysts are non-cancerous cysts that originate in the broad ligament and constitute approximately 10–20% of all adnexal lesions. When observed on MRI, these cysts typically appear as simple unilocular structures with low signal intensity (SI) on T1-weighted images (T1WI) and high signal intensity on T2-weighted images (T2WI). They exhibit a thin outer wall, measuring less than 3 mm, and are located adjacent to the ovary but remain separate from it [23] (Fig. 5).

Example of MRI appearance of a para-ovarian cyst. a Axial T2-weighted sequence. b Axial DWI lombo-pelvic scan (b: 1200 s/mm2). c Axial unenhanced T1-weighted in-phase sequence. d Axial late-gadolinium T1-weighted sequence. Left para-ovarian cyst (maximal diameter: 17 mm) white arrow
O-RADS MRI score 2: This category includes adnexal lesions that are almost certainly benign with a PPV for malignancy of less than 0.5%. It should be noted that observations scored as category 2 or higher represent non-physiologic lesions. The term "lesion" is preferred to "masses", "tissues" and "tumor" and should be adopted for standardization [1].
Definition: An adnexal lesion is defined as an adnexal observation which does not meet criteria for a physiologic finding. This is subdivided further into cystic lesion without solid tissue, cystic lesion with solid tissue, and solid lesion. Cystic lesions can be unilocular or multilocular. Purely solid lesions are defined as having less than 20% cystic component. O-RADS MRI score 2 includes: -Unilocular cyst with no wall enhancement and no enhancing solid tissue If no wall enhancement, may have any type of fluid content. If smooth wall enhancement, may have simple or endometriotic fluid content. -Lesion with lipid content and: No enhancing solid tissue. Only a small amount of enhancing tissue (Rokitansky nodule). -Lesion with homogenously hypointense solid tissue on T2WI and DWI. -Dilated fallopian tube with simple fluid content (hydrosalpinx) and no enhancing solid tissue. May demonstrate a thin, smooth wall/endosalpingeal folds with enhancement. -Para-ovarian cyst with no enhancing solid tissue. May contain any type of fluid content, and may have a thin, smooth wall +/− enhancement. |
Pitfall 1
It is important in this category to recognize simple fluid versus non-simple fluid within a cyst. Non-simple fluid may be endometriotic, hemorrhagic, proteinaceous, or lipid in composition [24].
Pearls 1
Simple fluid demonstrates the same signal intensity as cerebrospinal fluid (CSF) on all sequences.
Non-simple fluid can be characterized using the following lexicon descriptors:
-
Hemorrhagic fluid: The signal intensity can be heterogeneous and variable depending on the age of blood products. For instance, late subacute hemorrhage appears hyperintense on T1-weighted images (T1WI) and T2-weighted images (T2WI) (Fig. 6).
-
Endometriotic fluid: Typically appears homogeneously hyperintense on T1WI, with corresponding hypointensity on T2WI, commonly known as “T2 shading.” Only endometriotic fluid may have higher T1W signal than fatty content. Ancillary findings of endometrioma include multiplicity and the presence of “T2 dark spots,” representing blood clots, which support the diagnosis of endometrioma and aid in distinguishing it from hemorrhagic fluid (Fig. 6).
-
Proteinaceous fluid: Fluid composed of mucin, colloid, or purulent material may display variable high T1W signal (Fig. 6).
-
Fat- or lipid-containing fluid: Expected to appear hyperintense on both T1W and T2W images, with signal loss on fat-saturated sequences. Notably, the presence of intravoxel fat as detected on chemical shift T1WI out-of-phase sequences, even without detectable macroscopic fat, still represents “lipid-containing fluid” (i.e., dermoid) (Fig. 6).

MRI assessment of non-simple fluid. First column corresponding to T2-weighted signal. Second column corresponding to T1-weighted in-phase sequence. Third column corresponding to T1-weighted water-phase sequence. Fourth column corresponding to diffusion-weighted sequence. Last column corresponding to late gadolinium T1-weighted sequence. a Hemorrhagic fluid. b Endometriotic fluid. c Proteinaceous fluid in this case: pus inside an abscess. d Lipid-containing fluid
To recognize non-simple fluid, it is essential to always check T1WI without and with fat saturation, T1 in- and opposed phase, T2WI, and DWI.
Pitfall 2
Identification and proper classification of “dark T2/dark DWI” lesions is crucial in MRI evaluation (Fig. 7) [25,26,27]. The ACR O-RADS MRI committee introduced the term “dark T2/dark DWI” to describe lesions composed of fibrous tissues showing uniformly hypointense signal intensity on both T2-weighted and high-b-value DWI scans. Note, this only refers to the solid component in the lesion.

Illustration of the dark T2/DWI appearance on MRI. a Axial T2-weighted sequence. b Axial DWI abdominal and pelvicscan (b: 1200 s/mm2). c Axial unenhanced T1-weighted in-phase sequence. d Axial late gadolinium T1-weighted sequence. Right ovarian lesion classified O-RADS2 corresponding to a right ovarian fibroma (maximal diameter: 47 mm) (white arrow)
Adnexal lesions containing solid tissue and displaying characteristic homogenous dark T2/dark DWI signal intensity on MRI are categorized as O-RADS MRI 2 score, regardless of their enhancement characteristics. These lesions are benign, commonly representing either fibroma, fibrothecoma, Brenner tumor, or cystadenofibroma [27] (Fig. 7).
Pearls to correctly interpret findings on DWI [25, 26]:
-
✓
Using an optimal high b-value of at least 1000 s/mm2.
-
✓
Defining dark DWI as having the same signal intensity as simple fluid on high-b-value images (e.g., urine in the bladder), where premenopausal ovaries are moderately bright.
-
✓
Comparing the DWI signal intensity of the lesion with that on T2WI and ADC images.
-
✓
Applying the “dark T2/dark DWI” categorization for O-RADS 2 only if the entire lesion appears homogeneously dark on T2 and high-b-value DWI. If the lesion shows foci of restricted diffusion or intermediate T2 signal intensity within an otherwise dark T2/dark DWI lesion, it should not be categorized as O-RADS MRI Score 2.
-
✓
Restricted diffusion is defined as high signal intensity on high-b-value DWI with low signal intensity on the ADC map. However, this characteristic does not offer effective risk stratification for adnexal lesions as there is substantial overlap between benign and malignant lesions. The role of ADC quantification to refine O-RADS MRI score 4 remains an area of active research.
Pitfall 3
Lesions with lipid content and no or small amount of solid tissue (Rokitansky nodule) are classified as O-RADS MRI score 2 [28] (Fig. 8).

Example of MRI appearance of a Rokitansky nodule which does not account for a solid tissue. a Axial T2-weighted sequence. b Axial DWI abdominal and pelvic scan (b: 1200 s/mm2). c Axial unenhanced T1-weighted in-phase sequence. d Axial late-gadolinium T1-weighted sequence. Right ovarian dermoïd cyst with a small Rokitansky nodule (white arrow)
O-RADS MRI score 3: This category carries a low-risk for malignancy with a PPV of about 5%.
O-RADS MRI score 3 lesions include
Definition of O-RADS MRI score 3: -Unilocular cyst with proteinaceous, hemorrhagic, or mucinous fluid content and No enhancing solid tissue Smooth wall enhancement -Multilocular cyst with any type fluid content No enhancing solid tissue No lipid content May have smooth enhancing septae and wall -Lesion with solid tissue (excluding dark T2/dark DWI) with low-risk time intensity curve (TIC) on DCE MRI. -Dilated fallopian tube with no enhancing soft tissue nodule and: Non-simple fluid and thin walls/folds Simple fluid with thick, smooth walls/folds |
Significant efforts have been undertaken to clarify the lexicon terms “solid tissue” and “solid component,” which were previously used interchangeably and led to errors in the EURAD study, accounting for 63 out of 139 misclassified adnexal lesions [4]. The term “solid component” refers to any non-fluid component of a lesion and can be categorized into two types:
-
(1)
Solid components without enhancement, such as clot, hairs, calcifications, or debris.
-
(2)
Solid components with enhancement, including enhanced solid components that do not correspond to solid tissue, such as smooth thin or thick wall or septations, Rokitansky nodules, and endosalpingeal folds.
On the other hand, “solid tissue” is defined as exhibiting contrast enhancement and conforming to specific morphologies, namely papillary projections, mural nodules, irregular septations/walls, and larger solid portions.
A study by Thomassin-Naggara et al. found that 67 benign pelvic lesions were falsely classified as O-RADS MR 4 (false positive). Among these cases, over half (50.7%, 34/67) resulted from the misunderstanding of how solid tissue is defined in the lexicon [7].
Pearls: What is included in the definition of a solid tissue? (Fig. 9)

Example of solid tissue descriptors: a Axial T2-weighted sequence without fat saturation. b Axial unenhanced T1-weighted Water sequence showing papillary projections in bilateral serous borderline ovarian lesions (arrows). c Axial T2-weighted sequence without fat saturation. d Axial unenhanced T1-weighted Water sequence showing a large mural nodule (arrows) in a high-grade serous ovarian cancer. e Axial T2-weighted sequence without fat saturation. f Axial unenhanced T1-weighted Water sequence showing irregular septations (arrows) in bilateral serous borderline ovarian lesions. g Axial T2-weighted sequence without fat saturation. h Axial unenhanced T1-weighted Water sequence showing irregular wall (arrows) in a serous borderline bilateral ovarian tumor. i Axial T2-weighted sequence without fat saturation. j Axial unenhanced T1-weighted Water sequence showing irregular septations showing large solid component (arrows) high-grade serous ovarian cancer
• Papillary projection: An enhancing solid component emerging from the inner or outer wall or septation, displaying a branching architecture. • Mural nodule: An enhancing solid component measuring greater than 3 mm, originating from the wall or septation, with a nodular appearance. • Irregular septation: An enhancing linear strand extending from one internal surface of the cyst to the contralateral side, demonstrating an uneven margin. • Irregular wall: An enhancing cyst wall displaying an uneven margin. • Larger solid portion: An enhancing component of an adnexal lesion that does not fit into the categories of papillary projection, mural nodule, or irregular septation/wall. |
Pitfalls 1: What is not considered solid tissue?
-
Fat, clot, debris. Use of dedicated axial unenhanced T1-weighted in-, opposed-phased, fat and water sequence and subtraction images are particularly helpful in this setting.
-
Normal ovarian parenchyma
-
Rokitansky nodule (Figs. 8 and 10). Rokitansky nodule is a small solid component that may show enhancement, but it is not categorized as solid tissue. Thomassin-Naggara et al. reported that twenty mature cystic teratomas were misclassified, with 19/20 classified as O-RADS 4 or 5. These errors occurred because readers examined TIC and recorded intermediate or high-risk TIC in a Rokitansky nodule which should not considered soft tissue [7]. Rokitansky nodule can demonstrate enhancement due to the presence of smooth muscular cells and fibrous, neuroglial, or thyroid tissue [28].
Fig. 10 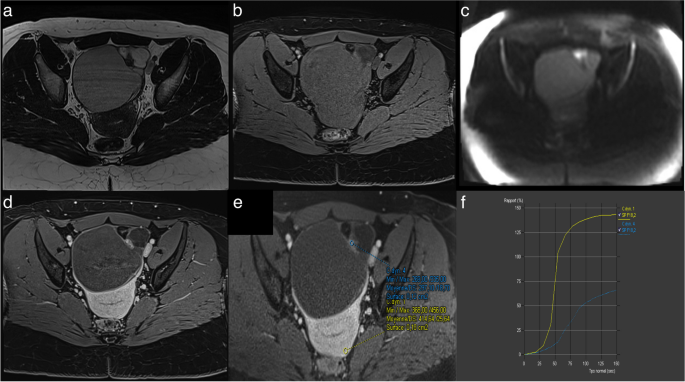
Example of mature cystic teratoma. a Axial T2-weighted sequence without fat saturation. b Axial unenhanced T1-weighted Water sequence. c Axial DWI scan (b: 1200 s/mm2). d Axial late-gadolinium T1-weighted sequence. e, f DCE T1-weighted sequence with corresponding curve of the external myometrium: yellow curve and Rokitansky protuberance: purple curve corresponding to a type I curve
-
Endosalpingeal folds (Fig. 11). Another common cause of false positives is the misinterpretation of endosalpingeal folds as papillary projections, especially in the context of pelvic inflammatory disease (PID). PID is typically associated with inflammatory processes, leading to thickening, and marked enhancement of the fallopian tube wall and endosalpingeal folds. A study by Thomassin-Naggara et al. reported that 11 out of 12 PID cases were incorrectly scored as O-RADS MRI category 4 or 5 because the TIC analysis was performed by placing a region of interest (ROI) on endosalpingeal folds or thickened wall [7]. Radiologists should exercise caution and consider all imaging findings, such as premenopausal status, tubular shape, inflammatory changes in adjacent structures, and the presence of pus within the lesion. Pus can be recognized as high signal intensity on high-b-value DWI with a corresponding low signal intensity on the ADC map.
Fig. 11 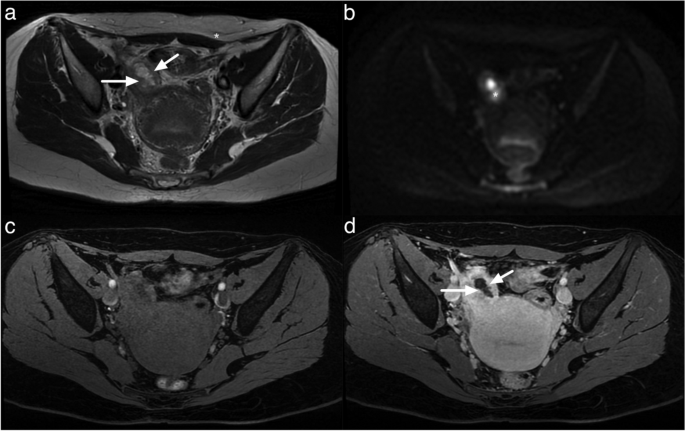
Example of MRI appearance endosalpingial folds. a Axial T2-weighted sequence. b Axial DWI lombo-pelvic scan (b: 1200 s/mm2). c Axial unenhanced T1-weighted water sequence. d Axial late-gadolinium T1-weighted sequence. Multiple endosalpingial folds (white arrow) potentially leading to a misinterpretation with ovarian vegetations. Note the hypersignal on the DWI scan corresponding to pus inside the fallopian tube (white star)
-
Fimbriated end of the tube may look like irregular solid tissue with strong enhancement and may be recognized thanks to its stellar morphology (Fig. 12)
Fig. 12 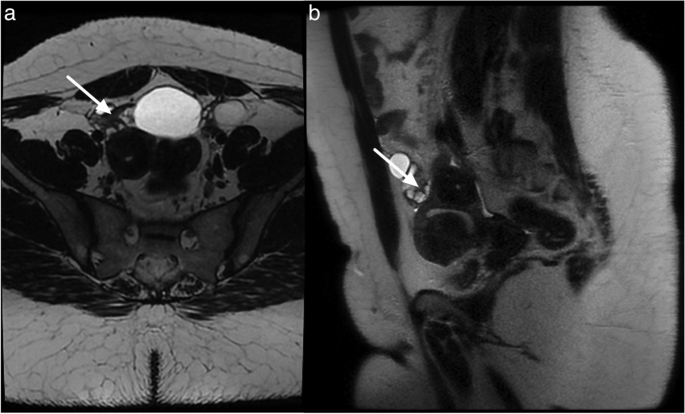
Fimbrial end of the tube between a dilated hydrosalpynx and the right ovarian structure. a Axial T2-weighted sequence. b Sagittal T2-weighted sequence. Stellar morphology of the fimbrial end of the tube (white arrow)
-
Smooth wall or septa (Fig. 13) as opposed to irregular wall or septa.
Fig. 13 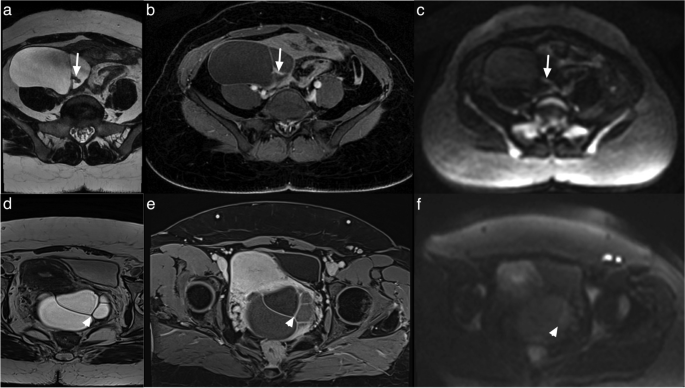
MRI appearance of a thick (first row, white arrow) and a thin septa (second row). a Axial T2-weighted sequence showing a thickened septa with tissular component. b Axial late-gadolinium T1-weighted sequence showing a tissular enhancement. c Axial DWI abdominal and pelvic scan (b: 1200 s/mm2) with hypersignal of the tissular component. d Axial T2-weighted sequence showing a thin septa. e Axial late-gadolinium T1-weighted sequence showing a thin enhancement. f Axial DWI abdominal and pelvic scan (b: 1200 s/mm2) showing no hypersignal


Pitfalls 2: Failure to recognize a low-risk TIC curve
A low-risk TIC curve is characterized by slow and gradual enhancement over time with no well-defined shoulder or plateau (Fig. 14). Some common errors involve difficulty in distinguishing the shoulder and plateau between low- and intermediate-risk TICs, while no confusion was observed between high-risk TICs versus intermediate and low-risk TICs. This misinterpretation led to 7 false positives and 4 false negatives, all of which were correctly identified by the blind readers who strictly adhered to the score rules [4]. As per the lexicon, a low-risk TIC (type 1 curve) does not exhibit a shoulder or plateau, even if the slope is acute, whereas an intermediate-risk TIC (type 2 curve) demonstrates a plateau and an initial slope that is less steep than that of the outer myometrium (Fig. 15) [4, 7, 29, 30].

Example of left ovarian lesion with a solid component with a type I dynamic enhancement curve. a Axial T2-weighted sequence without fat saturation. b Axial DWI scan (b: 1200 s/mm2). c Axial unenhanced T1-weighted water sequence. d Axial late-gadolinium T1-weighted sequence. e, f DCE MRI T1-weighted sequence with corresponding curve of the tissular component showing a type I curve. This was favored to be a benign cystadenofibroma

Difference between a type I curve and a type II curve. Same case as illustrated previously: a Axial T2-weighted sequence without fat saturation. b,c DCE MRI T1-weighted sequence with corresponding curve of the tissular component showing a type I curve corresponding to a cystadenofibroma. Other case with (d) Axial T2-weighted sequence without fat saturation. e, f DCE MRI T1-weighted sequence with corresponding curve of the tissular component showing a type II curve corresponding to a borderline serous cystadenoma
O-RADS MRI score 4 and 5
Definition of O-RADS MRI score 4: Adnexal lesions with an intermediate risk for malignancy as defined by a PPV of approximately 50%. O-RADS MRI score 4 lesions include: -Lesion with solid enhancing tissue (except for dark T2/dark DWI) with: Intermediate-risk TIC on DCE MRI. (If DCE MRI is not feasible, any lesion with enhancement ≤ myometrium at 30–40 s on non-DCE MRI. This analysis is less accurate than TIC analysis with a loss of specificity as no difference is feasible in the presence or absence of a plateau). -Lesion with lipid content and large volume enhancing solid tissue. |
Definition of O-RADS MRI score 5: Lesions in this category are considered high-risk with a PPV for malignancy of about 90%. O-RADS MRI score 5 lesions include: -Lesion with solid tissue (except for dark T2/dark DWI) with: High-risk TIC on DCE MRI. (If DCE MRI is not feasible, any lesion with enhancement > myometrium at 30–40 s on non- DCE MRI. This analysis has the same accuracy as TIC analysis). -Peritoneal, mesenteric, or omental nodularity or irregular thickening with or without ascites. |
Pearls
The use of DCE technique is recommended for the optimal evaluation of enhancement characteristics in adnexal lesions [4, 7, 29, 30]. This involves employing a 3-D T1WI fat-saturated sequence with a spatial resolution of 3 mm and temporal resolution of 15 s. During DCE acquisition, a region of interest is placed on the earliest enhancing region of the solid tissue to generate a Time-Intensity Curve (TIC). A second region of interest is placed on the outer myometrium, serving as a reference standard, while avoiding the arcuate vessels. The analysis is performed in percentage of enhancement or relative enhancement, requiring the initial phases of DCE MR to be obtained before the start of intravenous contrast injection. Three types of TICs have been defined [4, 7, 29, 30]. A low-risk or Type 1 curve demonstrates a gradual increase in enhancement over time without a shoulder or plateau, previously defined in O-RADS MRI 3 score (Fig. 14) [4, 7, 29, 30]. An intermediate risk or type 2 curve demonstrates moderate enhancement within the adnexal lesion, with an initial slope, followed by a shoulder and a plateau that is less than or equal to the myometrium (Fig. 15) [4, 7, 29, 30]. On the other hand, a high-risk or Type 3 curve exhibits a steeper initial slope than the myometrium, followed by a shoulder and a plateau, and the maximal enhancement may be higher or lower than the external myometrium (Fig. 16) [4, 7, 29, 30].

Example of bilateral ovarian lesion with a solid tissue with a type II dynamic enhancement curve (e) and type III dynamic enhancement curve (e). a Axial T2-weighted sequence without fat saturation and (b) Axial unenhanced T1-weighted water sequence show a mixed right cystic and solid lesion with (c) large enhancing solid tissue portion (d) with corresponding curve of the tissular component showing a type III curve (orange curve) (e) consistent with an O-RADS MRI 5 score. c Axial T2-weighted sequence without fat saturation and (f) DCE MRI T1-weighted sequence show a large left cystic lesion with solid tissue represented by papillary projections (arrow), corresponding to a type II curve (pink curve). Note the myometrium is represented by the yellow curve. The hypothesis of a low-grade serous ovarian cancer was made and later proven on histology
In cases where DCE is not available, a non-dynamic contrast-enhanced MRI may be obtained, including pre-contrast images and images acquired at 30 to 40 s after intravenous contrast injection. This helps in evaluating the relative enhancement of the solid component with the adnexal lesion compared to the outer myometrium, aiding in lesion classification (O-RADS MRI score 3 versus O-RADS MRI scores 4 and 5) [1, 24].
If the uterus is absent, differentiation between intermediate- and high-risk TICs becomes challenging, but a low-risk TIC can still be identified as showing progressive enhancement without a plateau [1, 24].
Specific tips to avoid curve pitfalls:
-
When dealing with small amounts of solid tissue, be cautious about motion artifacts that may affect the region of interest (ROI) in each phase. Note, a small amount of solid tissue is defined as solid tissue measuring up to 3 mm.
-
In cases of weak enhancement, consider evaluating the presence of a potential plateau before comparing it to the outer myometrium.
-
For mixed solid tissue with cystic content demonstrating high signal intensity on T1WI, it is beneficial to examine subtraction images.
Conclusion
The ACR Reporting and Data Systems (RADS) offer a standardized framework for characterizing and reporting imaging findings. The primary goal is to standardize terminology, minimize misinterpretation, and enhance communication between radiologists and referring clinicians. These goals can be accomplished though radiologist training and dissemination of knowledge about the lexicon and the use of risk scores. Similar to other RADS, proper application of O-RADS MRI system requires extensive training to facilitate its widespread use and accurate implementation in daily clinical practice.
Availability of data and materials
Not applicable.
Abbreviations
- ACR:
-
American College of Radiology
- DCE:
-
Dynamic contrast enhanced
- DWI:
-
Diffusion-weighted imaging
- IOTA:
-
International Ovarian Tumor Analysis
- MRI:
-
Magnetic resonance imaging
- O-RADS:
-
Ovarian-Adnexal Reporting and Data Systems
- TIC:
-
Time-Intensity Curve
- WI:
-
Weighted imaging
References
Reinhold C, Rockall A, Sadowski EA et al (2021) Ovarian-Adnexal Reporting Lexicon for MRI: A White Paper of the ACR Ovarian-Adnexal Reporting and Data Systems MRI Committee. J Am Coll Radiol 18(5):713–29. https://doi.org/10.1016/j.jacr.2020.12.022.
Nougaret S, Lakhman Y, Bahadir S, Sadowski E, Thomassin-Naggara I, Reinhold C (2023) Ovarian-Adnexal Reporting and Data System for Magnetic Resonance Imaging (O-RADS MRI): Genesis and Future Directions. Can Assoc Radiol J 74(2):370–81. https://doi.org/10.1177/08465371221121738.
Rizzo S, Cozzi A, Dolciami M, et al (2023) O-RADS MRI: A Systematic Review and Meta-Analysis of Diagnostic Performance and Category-wise Malignancy Rates. Radiology 307(1):e220795. https://doi.org/10.1148/radiol.220795.
Thomassin-Naggara I, Belghitti M, Milon A et al (2021) O-RADS MRI score: analysis of misclassified cases in a prospective multicentric European cohort. Eur Radiol 31(12):9588–99. https://doi.org/10.1007/s00330-021-08054-x
Van Calster B, Van Hoorde K, Froyman W et al (2015) Practical guidance for applying the ADNEX model from the IOTA group to discriminate between different subtypes of adnexal tumors. Facts Views Vis Obgyn 7(1):32–41
Andreotti RF, Timmerman D, Strachowski LM et al (2020) O-RADS US Risk Stratification and Management System: A Consensus Guideline from the ACR Ovarian-Adnexal Reporting and Data System Committee. Radiology 294(1):168–85. https://doi.org/10.1148/radiol.2019191150.
Thomassin-Naggara I, Poncelet E, Jalaguier-Coudray A et al (2020) Ovarian-Adnexal Reporting Data System Magnetic Resonance Imaging (O-RADS MRI) Score for Risk Stratification of Sonographically Indeterminate Adnexal Masses. JAMA Netw Open 3(1):e1919896. https://doi.org/10.1001/jamanetworkopen.2019.19896.
Saksouk FA, Johnson SC (2004) Recognition of the ovaries and ovarian origin of pelvic masses with CT. Radiographics 24(Suppl 1):S133-46. https://doi.org/10.1148/rg.24si045507.
Foshager MC, Hood LL, Walsh JW (1996) Masses simulating gynecologic diseases at CT and MR imaging. Radiographics 16(5):1085–99. https://doi.org/10.1148/radiographics.16.5.8888392
Karaosmanoglu D, Karcaaltincaba M, Karcaaltincaba D, Akata D, Ozmen M (2009) MDCT of the ovarian vein: normal anatomy and pathology. AJR Am J Roentgenol 192(1):295–9. https://doi.org/10.2214/AJR.08.1015.
Lee JH, Jeong YK, Park JK, Hwang JC (2003) “Ovarian vascular pedicle” sign revealing organ of origin of a pelvic mass lesion on helical CT. AJR Am J Roentgenol 181(1):131–7
Arikawa S, Uchida M, Shinagawa M, Tohnan T, Hayabuchi N (2006) Significance of the “ beak sign”in the differential diagnosis of uterine lipoleiomyoma from ovarian dermoid cyst. Kurume Med J 53(1–2):37–40
Kim JC, Kim SS, Park JY (2000) “Bridging vascular sign” in the MR diagnosis of exophytic uterine leiomyoma. J Comput Assist Tomogr 24(1):57–60
Stewart EA (2015) Clinical practice. Uterine fibroids. N Engl J Med 372(17):1646–55. https://doi.org/10.1056/NEJMcp1411029.
Takahashi S, Murakami T, Narumi Y et al (1998) MRI appearance of ruptured corpus luteum. Radiat Med 16(6):487–9
Wahab SA, Tobler JJ (2023) MR Imaging of Epithelial Ovarian Neoplasms Part I: Benign and Borderline. Magn Reson Imaging Clin N Am 31(1):43–52. https://doi.org/10.1016/j.mric.2022.06.003.
Valentini AL, Gui B, Micco M et al (2012) Benign and Suspicious Ovarian Masses-MR Imaging Criteria for Characterization: Pictorial Review. J Oncol 2012:481806. https://doi.org/10.1155/2012/481806.
Siddiqui S, Bari V (2021) Accuracy of MRI Pelvis in the diagnosis of ovarian endometrioma: using histopathology as gold standard. Cureus 13(12):e20650. https://doi.org/10.7759/cureus.20650.
Jha P, Sakala M, Chamie LP et al (2020) Endometriosis MRI lexicon: consensus statement from the society of abdominal radiology endometriosis disease-focused panel. Abdom Radiol (NY) 45(6):1552–68. https://doi.org/10.1007/s00261-019-02291-x.
Jaramillo-Cardoso A, Shenoy-Bhangle A, Garces-Descovich A, Glickman J, King L, Mortele KJ (2020) Pelvic MRI in the diagnosis and staging of pelvic endometriosis: added value of structured reporting and expertise. Abdom Radiol (NY) 45(6):1623–36. https://doi.org/10.1007/s00261-019-02199-6.
Rakheja R, Makis W, Hickeson M (2011) Bilateral Tubo-Ovarian Abscess Mimics Ovarian Cancer on MRI and (18)F-FDG PET/CT. Nucl Med Mol Imaging 45(3):223–8. https://doi.org/10.1007/s13139-011-0089-5.
Fan H, Wang TT, Ren G et al (2018) Characterization of tubo-ovarian abscess mimicking adnexal masses: Comparison between contrast-enhanced CT, (18)F-FDG PET/CT and MRI. Taiwan J Obstet Gynecol 57(1):40–46. https://doi.org/10.1016/j.tjog.2017.12.007.
Rezvani M, Shaaban AM (2011) Fallopian tube disease in the nonpregnant patient. Radiographics 31(2):527–48. https://doi.org/10.1148/rg.312105090.
Sadowski EA, Thomassin-Naggara I, Rockall A et al (2022) O-RADS MRI Risk Stratification System: Guide for Assessing Adnexal Lesions from the ACR O-RADS Committee. Radiology 303(1):35–47. https://doi.org/10.1148/radiol.204371.
Nougaret S, Tirumani SH, Addley H, Pandey H, Sala E, Reinhold C (2013) Pearls and pitfalls in MRI of gynecologic malignancy with diffusion-weighted technique. AJR Am J Roentgenol 200(2):261–276. https://doi.org/10.2214/ajr.12.9713
Mannelli L, Nougaret S, Vargas HA, Do RK (2015) Advances in diffusion-weighted imaging. Radiol Clin North Am 53(3):569–81. https://doi.org/10.1016/j.rcl.2015.01.002.
Shinagare AB, Meylaerts LJ, Laury AR, Mortele KJ (2012) MRI features of ovarian fibroma and fibrothecoma with histopathologic correlation. AJR Am J Roentgenol 198(3):W296-303. https://doi.org/10.2214/AJR.11.7221.
Cheng M, Causa Andrieu P, Kim TH et al (2023) Fat-containing adnexal masses on MRI: solid tissue volume and fat distribution as a guide for O-RADS Score assignment. Abdom Radiol (NY) 48(1):358–66. https://doi.org/10.1007/s00261-022-03688-x.
Thomassin-Naggara I, Soualhi N, Balvay D, Darai E, Cuenod CA (2017) Quantifying tumor vascular heterogeneity with DCE-MRI in complex adnexal masses: a preliminary study. J Magn Reson Imaging 46(6):1776–85. https://doi.org/10.1002/jmri.25707.
Thomassin-Naggara I, Darai E, Cuenod CA, Rouzier R, Callard P, Bazot M (2008) Dynamic contrast-enhanced magnetic resonance imaging: a useful tool for characterizing ovarian epithelial tumors. J Magn Reson Imaging 28(1):111–20. https://doi.org/10.1002/jmri.21377.
Funding
S. Nougaret is funded by the European Research Grant (ERC starting grant) and Integrated Cancer Research Grant (SIRIC). Y Lakhman is supported in part by NIH/National Cancer Institute Cancer Center Support Grant P30 CA008748.
Author information
Authors and Affiliations
Contributions
SN, ITN, LR, and ES conceived and designed the manuscript structure. NH, YL, ES, and AJC collected the literature, AR, ES, and NH contributed to literature analysis. SN, LR, ES, ES, YL, NH, AJC, and AR ITN contributed to manuscript writing. All authors read and approved the final manuscript.
Corresponding author
Ethics declarations
Ethics approval and consent to participate
Not applicable.
Consent for publication
Consent for publication was obtained.
Competing interests
YL consults for Calyx Clinical Trial Solutions. The remaining authors declare that they have no competing interests.
Additional information
Publisher's Note
Springer Nature remains neutral with regard to jurisdictional claims in published maps and institutional affiliations.
Rights and permissions
Open Access This article is licensed under a Creative Commons Attribution 4.0 International License, which permits use, sharing, adaptation, distribution and reproduction in any medium or format, as long as you give appropriate credit to the original author(s) and the source, provide a link to the Creative Commons licence, and indicate if changes were made. The images or other third party material in this article are included in the article's Creative Commons licence, unless indicated otherwise in a credit line to the material. If material is not included in the article's Creative Commons licence and your intended use is not permitted by statutory regulation or exceeds the permitted use, you will need to obtain permission directly from the copyright holder. To view a copy of this licence, visit http://creativecommons.org/licenses/by/4.0/.
About this article

Cite this article
Nougaret, S., Razakamanantsoa, L., Sadowski, E.A. et al. O-RADS MRI risk stratification system: pearls and pitfalls. Insights Imaging 15, 45 (2024). https://doi.org/10.1186/s13244-023-01577-5
Received:
Accepted:
Published:
DOI: https://doi.org/10.1186/s13244-023-01577-5